
GREEN CITIES SERIES | ARTICLE 18
Revised and updated September 2026
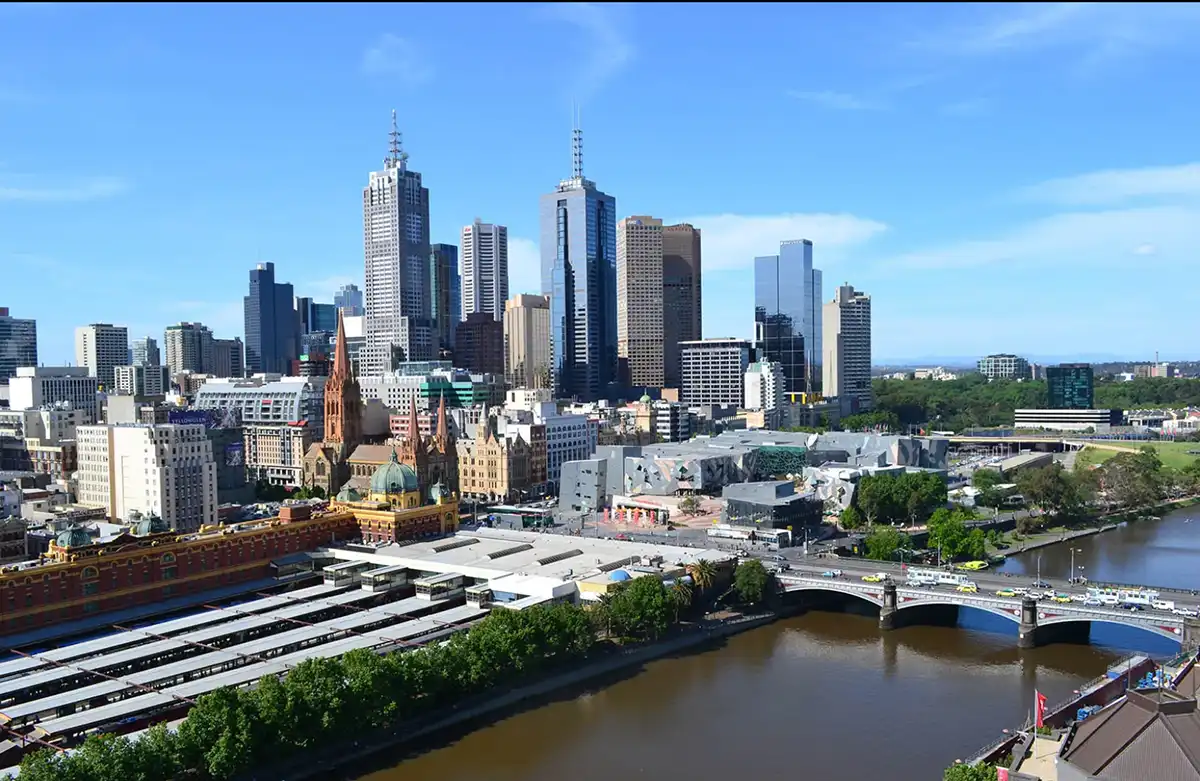
For two decades Melbourne traded on a reputation for liveability that the world’s urban rankings were happy to confirm. But the city those rankings described — compact, cultured, caffeinated, walkable — is only one Melbourne. The other is one of the most sprawling metropolitan areas in the Southern Hemisphere: car-dependent outer suburbs baking under a sun that is hotter every decade, with cooling, canopy and public transport that have not kept pace with the growth that made the liveability claim so commercially useful. The question is whether the city can reconcile these two versions of itself before the heat makes the question moot.
On the afternoon of Saturday 7 February 2009, the thermometer at Melbourne’s city weather station reached 46.4 degrees Celsius, the highest reading in the station’s history.1 The city had already been broken once that summer. At the end of January, three consecutive days above 43 degrees had buckled rail lines, cut power to hundreds of thousands of homes and filled the emergency departments; Victoria’s Chief Health Officer later counted 374 more deaths that week than the season should have produced.1 On 7 February the north wind blew across a landscape cured to tinder. The cool change that reached the city late in the day turned the flank of the Kilmore East fire into a front, and that night 173 people died in the Black Saturday fires at Kinglake, Marysville and Churchill in the Latrobe Valley.1
Seventeen years later, on Tuesday 27 January 2026, the state record set on Black Saturday fell. Walpeup and Hopetoun, in the Mallee, reached 48.9 degrees. At Melbourne Park the Australian Open closed its roofs and suspended play on the outside courts. The city station at Olympic Park peaked at 42.7 degrees just before five o’clock. Laverton, in the western suburbs, had reached 45.5; Point Cook 45.3; the airport, in the north-west, 44.1.2 Nobody died that day, as far as the record shows. But the three degrees between the inner city and the west were not weather. They are the subject of this article: the difference between the Melbourne the rankings measure and the Melbourne where most Melburnians live.
The heat and the fire are ecologically one event, though they are usually discussed separately. The same heat that broke the city’s infrastructure in 2009 cured the ranges to the north and east into fuel. Black Saturday remains Australia’s deadliest bushfire. Its royal commission changed how Victoria thinks about fire, about building in the bush, and about the link between a warming climate and catastrophe. What it did not change — and what is still, seventeen years later, only partly changed — is how Melbourne builds itself: how far out, how dense, how green, and how prepared for a future in which days like 7 February are no longer once-in-a-generation events.
Melbourne has spent the years since 2009 doing two things at once. It has built a set of environmental programmes — an urban forest strategy, heat mapping, a municipal net-zero target and, lately, a state-wide canopy rule — that are among the most serious in Australia and have drawn international attention. And it has kept growing outward, suburb by suburb, into a footprint that now extends more than sixty kilometres from the city centre in some directions: a dispersed, car-dependent, heat-exposed metropolis that those programmes were not designed to cool at scale.
A City Built for a Climate That Is Leaving
Melbourne was founded in 1835 on the north bank of the Yarra, at the head of Port Phillip Bay, in a temperate coastal climate that settlers found hospitable by the standards of what they had endured further north. The city that grew there was shaped by assumptions about weather that are becoming unreliable: that summers would be hot but bearable, that rain would be roughly sufficient, that the Dandenong Ranges to the east would moderate the worst of the inland heat. The assumptions were always partly wrong — the city’s own joke is four seasons in one day — but they calibrated its tree choices, its housing and its urban form for a climate that is measurably no longer the one it has.
The gold rush of the 1850s made Melbourne, briefly, one of the richest cities on earth, and it built accordingly: wide boulevards, large parks, grand institutions and a tramway network that by the 1920s was among the most extensive in the Southern Hemisphere.3 The inner city that emerged — the grid, the terrace suburbs of Carlton, Fitzroy, Collingwood and Richmond, the garden suburbs of Hawthorn, Camberwell and Kew — was and remains a pleasant place. Its wide streets carry mature canopy. Its mix of park and terrace cools passively. Its tram grid makes a car optional. This is the Melbourne the liveability rankings measure, and it is a real place, inhabited by people whose quality of life is high.
The problem is that it houses a minority of the metropolis. The city grew fastest after the Second World War, under a land-release model and a freeway programme that together produced the pattern visible from any aircraft descending toward Tullamarine: an ocean of low-density housing running to every horizon, broken by shopping strips and arterial roads, with canopy thinning and transit thinning as the distance from the centre grows.
By mid-2025 Greater Melbourne held about 5.4 million people and was adding roughly 140,000 a year — a Ballarat every twelve months. On the Bureau of Statistics’ narrower urban-area measure it had already passed Sydney; on the wider metropolitan measure Sydney still leads by a shrinking margin.4 The state’s own projections put Melbourne at around eight million by 2051. Where those extra millions will live, in what kind of housing, with what access to shade and public transport, and in what relation to a climate warming faster than the global average — these are the questions Melbourne’s planning is trying, imperfectly and urgently, to answer.
The Science of a Heating City
Australia has warmed by about 1.5 degrees since 1910, and the warming has accelerated since the 1980s.5 In Melbourne the number of days above 35 degrees has risen markedly; days above 40 — the threshold at which heat illness becomes acute for vulnerable people and infrastructure begins to fail — have roughly doubled since records began. The nights are warming too, and warm nights matter: a body that cannot cool in the dark does not recover from the day, and excess deaths in heat events track overnight minimums as closely as afternoon maximums.
The urban heat island adds several degrees to this. In Melbourne it is strongest not in the dense centre but in the newer west and north, where dark roofs, wide roads and bare nature strips make the built surface hotter than the paddocks around it.6 The 27 January readings — 45.5 at Laverton, 42.7 in the city — are the pattern in a single afternoon. And the pattern follows the familiar geography of environmental injustice. The outer suburbs house lower incomes, newer arrivals and families priced out of the inner ring. They have less canopy. Their housing, built under weaker efficiency standards, is harder to keep cool. Their residents are more likely to work outdoors, less likely to afford the power bill on a forty-degree day, and further from the cool of the inner-city parks and pools.
The health data is unambiguous. Lucinda Coates and her colleagues, working through 167 years of Australian records, found that extreme heat has killed more Australians than every other natural hazard combined.7 The January 2009 heatwave produced 374 excess deaths in Victoria; the January 2014 heatwave, 167.7 Globally, a study in The Lancet Planetary Health attributed about five million deaths a year to non-optimal temperatures and found the heat-related share rising.7 These deaths are largely invisible. They arrive in the statistics as heart attacks, strokes and respiratory failure among the elderly, the isolated, outdoor workers and the poorly housed, and they produce none of the imagery that mobilises a political response the way a fire or a flood does.
The Urban Forest: A Serious Programme
Against this background the City of Melbourne’s Urban Forest Strategy, adopted in 2012 with a horizon of 2032, stands as one of the most technically rigorous greening programmes in Australia and one of the more credible in the world.8 Its origin is instructive. It was not driven primarily by 2009 or by climate politics, though both contributed. It was driven by dying trees. The Millennium Drought had accelerated the decline of the elms and planes planted along Royal Parade and St Kilda Road in the nineteenth century, and the council’s arborists calculated that 39 per cent of the municipality’s trees would be lost within two decades.8 Replacing a generation of trees takes thirty to fifty years from planting to maturity. The city needed to start immediately, and differently.
The strategy set a target of 40 per cent canopy cover across the public realm by 2040, from a 2012 baseline of 22 per cent, and committed to a forest in which no species would exceed 5 per cent of the population, no genus 10 per cent and no family 20 per cent — a hedge against the pests, pathogens and heat that can take a monoculture in a single season.9
It also built a public inventory. Every tree in the municipality was mapped with its species, age, condition and life expectancy, and each was given an email address so that residents could report problems. Residents wrote instead to say thank you. About three thousand letters arrived in the first year; a golden elm beside Punt Road became a minor international celebrity.10 The coverage was global, the response unplanned, and the exercise achieved something that public engagement in environmental planning rarely does: it made the city’s green infrastructure feel personal to people who had experienced it as background.
Fourteen years on, the results are measurable. More than 33,000 trees have been planted since 2012; the inventory now holds over 80,000; public-realm canopy has climbed from 22 per cent into the high twenties, tracked by annual aerial and LiDAR survey and reported with unusual candour about what died and why.11 Rohan Leppert, the councillor who has carried the environment portfolio through most of this period, called the first round of neighbourhood tree plans the best thing the council had done to connect with its communities; a second round of precinct plans — for the central city, Carlton, East Melbourne, South Yarra, Docklands, Kensington, and North and West Melbourne — has been endorsed through 2025 and 2026.11 The survival question remains central. A tree planted is not a tree established, and the hot, dry summers since 2019 have cost the city a share of its young plantings; the species list, soil standards and watering regimes have been revised in response.
The programme has also confronted a conflict rarely discussed in urban forestry: the war between roots and services. Beneath the inner-city footpath lies a congested layer of gas, water, sewer, stormwater, power and fibre, laid without coordination over a century and a half. Roots follow moisture into old clay pipes, lift paving and generate the complaints, removals and replantings that have historically stopped urban trees reaching the age at which they do most good. Melbourne’s answer — structural soil cells beneath paving, larger pits with engineered soil volumes, root barriers around sensitive services — adds a great deal to the cost of each tree and substantially improves its chance of growing old.
What the strategy cannot do is reach beyond the municipal boundary. The City of Melbourne is 37 square kilometres and fewer than 200,000 residents at the centre of a metropolis of nearly ten thousand square kilometres and 5.4 million people. The attempt to scale the idea began with Living Melbourne, a 2019 metropolitan urban forest strategy developed with the region’s 32 councils and led by Resilient Melbourne and The Nature Conservancy.12
It moved to statute in 2025. Plan for Victoria, which replaced Plan Melbourne as the state’s land-use plan in February that year, set a 30 per cent canopy target for urban areas; in September the planning provisions were amended to require a permit to remove a canopy tree taller than five metres in most residential zones, and to require minimum canopy on new lots.13 A state programme has planted half a million trees in the west and has been funded to plant half a million more in the councils with the least shade and the highest heat vulnerability.13 These are the right instruments. They are also new, and untested against a housing boom.
The Tram and the Freeway: A City in Transport Contradiction
Melbourne’s tram network is the largest in the world and one of the city’s most embedded institutions: 250 kilometres of double track, about 1,700 stops, roughly five hundred vehicles and more than 200 million passenger trips a year before the pandemic.14 It is the city’s most legible claim to transit-oriented urbanism, and it is real. The inner and middle suburbs inside the tram grid — roughly the area within eight kilometres of the centre — have commuting mode shares that match comparable European cities. The tram is embedded in Fitzroy and South Yarra and St Kilda the way the Tube is embedded in Islington.
The problem is where the tram does not go. The network was fixed in its present extent by the mid-twentieth century, when the same automotive orthodoxy that tore up the tracks in Los Angeles and London halted expansion here and turned the money to freeways. Melbourne, unlike Los Angeles, kept what it had — a piece of institutional good fortune whose value compounds every year. But it did not extend the grid into the postwar suburbs that absorbed most of its growth. Those suburbs got a radial rail network, buses that are chronically underfunded, and freeways that made the car not merely convenient but mandatory.
The transport geography therefore maps almost exactly onto the geography of heat and canopy: tram-served inner suburbs where a car is optional, tree cover is high and the heat island is moderated; car-dependent outer suburbs where a car is required for every trip, canopy is sparse and the heat island is fiercest.15 The state’s household travel survey records the split with uncomfortable clarity: in the outer growth areas the private car accounts for the great majority of trips; in the inner suburbs, half or fewer. The difference is not culture. It is the presence or absence of an alternative.
The state’s response — Victoria’s Big Build, the largest public transport programme in its history — is real and substantial. The Metro Tunnel, twin nine-kilometre bores beneath the city linking the Sunbury line to the Cranbourne and Pakenham lines through five new underground stations, opened to passengers on 30 November 2025 after a decade of construction; 70,000 people rode it on the first day, and the full timetable switched over on 1 February 2026.16 Eighty-eight of the 110 level crossings scheduled for removal by 2030 were gone by January 2026, and four lines — Lilydale, Pakenham, Cranbourne and Sunbury — are now free of boom gates.16
The Suburban Rail Loop, a 90-kilometre orbital line around the middle suburbs, began tunnelling in September 2026 on its 26-kilometre eastern section between Cheltenham and Box Hill. It is also the most contested project in the state. The Auditor-General reported on 26 August 2026 that the eastern section will more likely than not exceed its $34.5 billion ceiling, that trains by 2035 are unlikely, and that a $5.5 billion hole remained in approved funding; a day earlier the new premier, Ben Carroll, had cut a billion dollars of scope and folded the project’s authority into the state’s infrastructure agency.17 The northern and western sections, which would serve the suburbs where the need is greatest, have no funding; the north’s notional completion date is in the 2050s, and the west has none.
These are significant investments, and their benefits fall mostly where transit use is already high. The new suburbs in the outer west around Tarneit and Wyndham Vale, and in the outer north around Craigieburn and Mernda, reach populations in the tens of thousands before the rail service catches up. Their residents are committed, by the sequence of delivery, to car dependence for the formative decades of their neighbourhoods. And the state has not stopped building roads. The West Gate Tunnel, a tolled freeway under Yarraville first promised in 2014 at $500 million, opened on 14 December 2025 at $10.2 billion, three years late and nearly double its contracted price; the North East Link, at more than $26 billion, follows.18 The contradiction is not hypocrisy so much as arithmetic: a city that has already been built for the car cannot be unbuilt in a decade, and the freeway ledger still runs alongside the rail one.
Water: The Millennium Drought and What Came After
Melbourne’s relationship with water was remade by the Millennium Drought, the dry period from roughly 1997 to 2009 that took the city’s reservoirs from near full to about a quarter.19 The drought produced two lasting responses. The first was demand management — staged restrictions, tiered pricing, appliance standards and a public culture of the four-minute shower — that cut residential use from about 250 litres per person per day in the 1990s to about 150 by the mid-2010s.19 The second was the Victorian Desalination Plant near Wonthaggi on the Bass Coast, a reverse-osmosis works able to supply up to 150 gigalitres a year, roughly a third of the city’s needs, built for about $3.5 billion and operated under a contract whose availability payments run to the late 2030s whether or not water is ordered.20
For a decade the plant was the most argued-over piece of infrastructure in the state, because the drought broke the year before it was commissioned and the catchments refilled. No water was ordered for four years after commissioning. Then the orders began — 50 gigalitres in 2016–17, 125 a year through the dry seasons of 2019 to 2022 — and stopped again for three wet years. Since 2016–17 the plant has delivered 505 gigalitres, roughly a year and a half of the city’s consumption.20
Then the catchments dried. From July 2024 to June 2025 inflows to Melbourne’s storages ran 36 per cent below the thirty-year average, with the lowest January-to-June inflows on record; residential use crept back up to 169 litres a head as the summers lengthened. Storages fell from 86 per cent at the end of 2024 to 75 per cent a year later and 63 per cent by June 2026 — the steepest annual decline since the Millennium Drought.21 On 7 April 2026 the Minister for Water, Gayle Tierney, ordered the plant’s full 150 gigalitres for 2026–27, the eighth order in ten years, and had delivery start a month early. In the state’s own words, desalinated water is now “a normal part” of the supply. In September 2026 storages sit at 69 per cent, and the water corporations rate restrictions for the coming summer as possible.21 The insurance policy, so expensive to hold, is being drawn on.
The Yarra — the Birrarung, in the language of the Wurundjeri — runs from the ranges to the bay through the middle of all this. In 2017 the state passed the Yarra River Protection (Wilip-gin Birrarung murron) Act, the first Australian law to treat a river as a single living and integrated natural entity and to carry Aboriginal-language purposes in its preamble.22 It did not, as is often said, make the river a legal person; unlike New Zealand’s Whanganui settlement, it confers no standing to sue. What it did was create the Birrarung Council, with Wurundjeri members, to speak for the river in planning, and require a fifty-year community vision and a strategic plan, Burndap Birrarung burndap umarkoo, adopted in 2022, which binds the councils and agencies along the corridor.22
The river’s condition is mixed. Water quality has improved enormously since the 1970s, when the urban reach was functionally dead, and platypus, native fish and migratory birds have returned to stretches that were inhospitable for decades. But stormwater from the metropolis’s vast impervious surface still flushes sediment, nutrients and litter into the river after every storm, and that is structurally hard to fix without changing the drainage of the whole basin.
The More-Than-Human City: Biodiversity on the Urban Frontier
Melbourne sits on the eastern edge of the Victorian Volcanic Plain, whose basalt grasslands once ran from the city’s western fringe to the South Australian border and of which, by most estimates, less than one per cent survives in good condition. The urban development that has transformed the region over 191 years has come at a severe ecological cost: the grassy woodlands and dry forests of the east, the riparian vegetation of the Yarra and its tributaries, and the heath and wetland of the bay edge have been progressively cleared, drained and built over.
What remains is fragmented, pressured and significant precisely because there is so little of it. The Natural Temperate Grassland of the Victorian Volcanic Plain is listed as critically endangered under national law, and it supports species found nowhere else — the striped legless lizard, the golden sun moth, the spiny rice-flower, the growling grass frog.23 It persists in road verges, old cemeteries, the margins of industrial estates and a handful of reserves declared before its rarity was understood. The Urban Growth Boundary, which the state draws and periodically redraws, decides its fate. Each extension converts irreplaceable ecological heritage to housing in ways that no amount of greening inside the built city can compensate for.
The state’s answer, in 2010, was a bargain called the Melbourne Strategic Assessment: development in the growth corridors could proceed under a single national approval, and in exchange a levy on developers would buy a 15,000-hectare Western Grassland Reserve, the largest consolidated native grassland in Australia, by 2020.24 Sixteen years later roughly a quarter of the reserve has been purchased. The Auditor-General found in 2020 that the commitment had not been met; the programme’s own strategic audit, published in November 2025, found grassland quality declining across the reserve area, weak enforcement of state and national law, and no progress at all on a companion 1,200-hectare grassy woodland reserve.24
In the summer of 2024–25 a property at Mount Cottrell, zoned for conservation and earmarked for public acquisition, was ploughed almost bare; in 2023 the state was ordered to pay developers $92 million in compensation for land it had reserved but not bought.24 Sarah Bekessy, the RMIT conservation scientist who has tracked the programme from its inception, has argued for years that offsets which are never delivered are not offsets but permissions. You cannot compensate for a grassland with a promise.
Within the built city, by contrast, the biodiversity story has real successes. The Western Treatment Plant at Werribee — 10,500 hectares of sewage lagoons and pasture managed by Melbourne Water — is one of the most important waterbird sites in the country, a Ramsar wetland that carries hundreds of thousands of ducks, waders and migratory shorebirds on land that is also working infrastructure.25 The Merri Creek corridor through the inner north, managed for more than three decades by a committee of councils and community groups, holds platypus, rakali and native fish in a waterway that runs between some of the densest suburbs in Australia. These places show that ecological function is achievable in a city — not as reserves fenced off from it, but as working corridors threaded through the built fabric.
The Two Cities: Inner Comfort and Outer Exposure
The inequality between Melbourne’s inner and outer suburbs is not a subtle finding requiring careful statistics to demonstrate. It is visible from a satellite, legible in property prices, and measurable in the health of the respective populations. The question is whether the city’s institutions are moving fast enough, and pointing resources at the right places, to close a gap that widens as the climate warms.
Thami Croeser, an urban planner at RMIT, puts the threshold plainly: measurable cooling needs about 40 per cent canopy within sixty metres of a home, and only a fraction of Melbourne’s houses have it, with many suburbs at 10 per cent or below.26 The growth-corridor councils — Wyndham, Melton, Whittlesea, Cardinia, Hume, Casey — have their own planting programmes, but they run on smaller budgets, with less institutional depth, in a landscape where the dominant process is greenfield construction on sites that start treeless and often stay that way for years after the houses are occupied. Developers must plant street trees, but the species, the soil volumes and the watering contracts are often inadequate to establish the canopy the suburb will need as the climate warms. The state’s new tree programmes and the 30 per cent target are aimed at exactly this deficit. They are also aimed at it a generation late.
The housing stock compounds the problem in ways trees cannot fix. Australia has long had among the weakest residential efficiency standards of any developed country. The National Construction Code now requires seven stars for new homes — Victoria adopted the standard in May 2024 — but the cumulative stock built under earlier rules, single-brick or lightweight, poorly insulated, with large glass and dark roofs, remains the dominant type across the postwar suburbs.27 Retrofitting is technically simple and pays for itself in energy, but the scale — hundreds of thousands of houses needing insulation, shading, lighter roofs and, where possible, solar and storage — exceeds the capacity of the subsidy programmes in place. The Victorian Energy Upgrades scheme has delivered real numbers of ceiling-insulation jobs and appliance replacements; its pace is well below what the stock and the climate together demand.
Renters are the most exposed. About 30 per cent of Melbourne households rent, and the share is higher in the outer suburbs where affordability bites hardest.28 Better Renting’s summer monitoring, in which tenants log indoor temperatures through the hottest months, has recorded rental homes spending much of the summer above recommended indoor temperatures. The landlord has little incentive to improve a property they do not live in; the tenant has little power to.
This is the split-incentive problem that has stalled retrofit in Berlin and London, and Victoria has done something about it that few jurisdictions have. Regulations made in 2025 require, from 1 March 2027, that any rental let without ceiling insulation have it installed at the start of the lease, that new leases include an efficient fixed cooler in the main living room, and that failed gas heating and hot water be replaced with electric; draughtproofing follows from July 2027, and by July 2030 every rental in the state must meet the cooling standard regardless of lease.28 The standards are staged, hedged with exemptions and enforced through a tribunal that tenants are reluctant to use. They are also the first serious attempt in Australia to legislate the right to a cool room.
What Is Working, and Why It Matters
The case for taking Melbourne’s environmental credentials seriously, despite everything above, rests on things that are true and deserve to be stated precisely.
The Urban Forest Strategy has produced results that can be measured and checked. The council counts its trees, publishes their condition, maps canopy every year and reports failures as readily as successes — an institutional habit of learning rather than announcing that is rare in urban environmental management. The Lord Mayor, Nick Reece, has recommitted the council to three thousand plantings a year to hold the 2040 target.11
The heat has been mapped. Monash researchers built a heat-vulnerability index for Melbourne’s suburbs a decade ago, combining surface temperature, canopy, age, income and isolation at the scale of a census block, and the state’s Cooling and Greening Melbourne map extended the thermal mapping across the whole metropolis.29 Investment can now be pointed at the hottest and poorest streets rather than spread evenly or steered to where the complaints are loudest. It is the kind of spatial evidence that Bogotá and Barcelona have used to the same end, and Melbourne’s version has been adopted elsewhere.
The Big Build is a structural commitment to the shift the city’s future requires, however uneven its geography. The Metro Tunnel has added capacity on the network’s two most crowded corridors. The level crossing programme has made surface rail more reliable on lines serving hundreds of thousands of people. The Suburban Rail Loop, if it is finished, will change the transport geography of the middle suburbs; whether it should have come before an airport line and better western services is a question the November 2026 election will help answer.
And the state has finally begun to regulate the private realm. The canopy permit rule, the minimum-canopy requirement on new lots, the rental efficiency standards and the all-electric requirement for new homes together amount to the first legislative acknowledgement that shade and cooling are rights rather than amenities. The City of Melbourne’s own operations have been certified carbon neutral since 2012, and its net-zero target for the municipality is 2040 — though the emissions that matter, from cars, gas and the housing stock of the outer suburbs, sit outside any council’s reach.30
Liveability, Reconsidered
The Economist Intelligence Unit’s Global Liveability Index, which ranked Melbourne first in the world from 2011 to 2017 and made the word a civic slogan, measures what it measures: stability, healthcare, culture and environment, education and infrastructure, assessed largely by conditions in the centre and the inner suburbs. It does not measure the temperature in Tarneit on a day above 45 degrees. It does not measure the hours a Wyndham Vale resident spends in a car because no train serves her shift. It does not measure the survival rate of saplings staked on a new nature strip without a watering contract.
None of this makes Melbourne’s programmes unserious. The Urban Forest Strategy is among the best of its kind in the world. The transport investment is real and consequential. The Birrarung legislation is an institutional invention whose implications reach well beyond Victoria. The rental standards are ahead of the rest of the country. These things matter and should be said plainly.
But they matter in proportion to the problem they address, and that problem — 5.4 million people in a sprawling, car-dependent, thinly canopied, poorly insulated suburban fabric, growing toward eight million by mid-century in a climate warming faster than the world’s, with the reservoirs falling and the state record broken in January — is larger than the programmes are yet sized for. The city the rankings describe is real. It is also only part of the city, and the part left out is the part where the heat deaths occur, where the car kilometres accumulate, where the grassland goes under the slab, and where the question of what Melbourne will be in 2050 will actually be decided.
On the afternoon of 27 January 2026, while the Australian Open closed its roofs, a new street in Tarneit stood in full sun. Brick veneer, dark tiles, pale concrete, the lawns already yellow. The saplings in the nature strip were two summers old and still staked. The people who live here are working hard, at some distance from most of what makes the liveability ranking legible. If the saplings survive this summer and the next, if the watering contract holds, if the council’s programme reaches this street before it reaches the next one, there will be shade here in ten years. It will not, by then, be enough. But it will be something, and in the making of a city that can survive its own future, something is where you have to start.
Endnotes
1. Bureau of Meteorology, daily maximum temperature record for the Melbourne Regional Office station, 7 February 2009 (46.4°C). On the late-January heatwave and its toll: Victorian Department of Human Services, January 2009 Heatwave in Victoria: An Assessment of Health Impacts (2009), which estimated 374 excess deaths. On the fires: 2009 Victorian Bushfires Royal Commission, Final Report (2010).↩
2. Bureau of Meteorology observations for 27 January 2026 as reported by ABC News, ‘Victorian maximum temperature record broken as heatwave engulfs Australia’, 27 January 2026: 48.9°C at Walpeup and Hopetoun; Laverton 45.5°C; Point Cook 45.3°C; Melbourne Airport 44.1°C; Olympic Park 42.7°C. On the Australian Open’s extreme-heat protocols that day: Associated Press, 27 January 2026.↩
3. Geoffrey Serle, The Rush to Be Rich: A History of the Colony of Victoria 1883–1889 (Melbourne University Press, 1971); Graeme Davison, Car Wars: How the Car Won Our Hearts and Conquered Our Cities (Allen & Unwin, 2004). The Melbourne and Metropolitan Tramways Board ran the network from 1919; it reached its greatest extent in the 1920s.↩
4. Australian Bureau of Statistics, Regional Population (2023–24 release, March 2025; 2024–25 release, 2026): Greater Melbourne grew by 142,600 in 2023–24 to about 5.35 million; on the Significant Urban Area measure Melbourne (5.33 million) exceeded Sydney (5.22 million) at June 2025. Projections: Department of Transport and Planning, Victoria in Future 2023.↩
5. CSIRO and Bureau of Meteorology, State of the Climate 2024: Australia’s climate has warmed by 1.51 ± 0.23°C since national records began in 1910. Frequencies of extreme-heat days from the Bureau’s climate data for Melbourne (Regional Office and Olympic Park).↩
6. C. J. G. Morris and I. Simmonds, ‘Associations between varying magnitudes of the urban heat island and the synoptic climatology in Melbourne, Australia’, International Journal of Climatology 20 (2000); A. M. Coutts, J. Beringer and N. J. Tapper, ‘Impact of increasing urban density on local climate: spatial and temporal variations in the surface energy balance in Melbourne, Australia’, Journal of Applied Meteorology and Climatology 46 (2007); Department of Environment, Land, Water and Planning, Cooling and Greening Melbourne Interactive Map (2018), which maps land-surface temperature and vegetation across the metropolitan area.↩
7. Lucinda Coates, Katharine Haynes, James O’Brien, John McAneney and Felipe Dimer de Oliveira, ‘Exploring 167 years of vulnerability: An examination of extreme heat events in Australia 1844–2010’, Environmental Science & Policy 42 (2014). Victorian Department of Health, The Health Impacts of the January 2014 Heatwave in Victoria (2014): 167 excess deaths. Qi Zhao et al., ‘Global, regional, and national burden of mortality associated with non-optimal ambient temperatures from 2000 to 2019: a three-stage modelling study’, The Lancet Planetary Health 5 (2021).↩
8. City of Melbourne, Urban Forest Strategy: Making a Great City Greener 2012–2032 (2012). The projected loss of 39 per cent of trees within two decades is the strategy’s own figure.↩
9. Canopy and diversity targets: Urban Forest Strategy (2012), and the City of Melbourne’s current summary at melbourne.vic.gov.au/urban-forest-strategy.↩
10. City of Melbourne, Urban Forest Visual (melbourneurbanforestvisual.com.au). On the letters: Monica Tan, ‘Leaf letters: fan email for Melbourne’s trees pours in from around the world’, The Guardian, 15 July 2015; the council reported about 3,000 emails in the programme’s first year.↩
11. City of Melbourne media releases and Urban Forest Precinct Plans (2024–26): more than 33,000 trees planted since 2012 (May 2024); tree population above 80,000 (July 2024); Lord Mayor Nick Reece’s commitment to 3,000 plantings a year (July 2025). Cr Rohan Leppert quoted in CBD News, 25 July 2024. Canopy in the high twenties is the council’s own reporting, as cited in Docklands News (August 2021) and the 2024 precinct plans; the council has not published a single current municipality-wide figure in the material consulted.↩
12. Resilient Melbourne and The Nature Conservancy, Living Melbourne: Our Metropolitan Urban Forest (2019).↩
13. Victorian Government, Plan for Victoria (February 2025), Action 12; Amendments VC283 (2 September 2025) and VC289 (15 September 2025), the latter introducing clause 52.37 (Canopy trees) with minimum canopy of 10 per cent on lots up to 1,000 square metres and 20 per cent above. Premier of Victoria, ‘500,000 More Trees for Melbourne’, September 2025 (More Trees for a Cooler Greener West; More Trees in Melbourne, $9.5 million).↩
14. Yarra Trams and Department of Transport network data: 250 kilometres of double track, about 1,700 stops; Department of Transport, Annual Report 2018–19: roughly 206 million tram trips.↩
15. Australian Urban Observatory, RMIT Centre for Urban Research (auo.org.au), which maps transport access, canopy, heat and socio-economic indicators by suburb; Department of Transport and Planning, Victorian Integrated Survey of Travel and Activity (VISTA).↩
16. Victoria’s Big Build, Metro Tunnel project documentation; ABC News, 30 November 2025; International Railway Journal, 1 December 2025 (70,000 riders on opening day; full timetable from 1 February 2026). Level crossings: Victoria’s Big Build, ‘Celebrating 10 years of level crossing removals’, January 2026 (88 removed; four lines boom-gate free).↩
17. Victorian Auditor-General’s Office, Delivering the Suburban Rail Loop (tabled 26 August 2026). ABC News, 25 and 27 August 2026, on Premier Ben Carroll’s $1 billion scope reduction, the folding of the Suburban Rail Loop Authority into the Victorian Infrastructure Delivery Authority, and the abolition of the fare levy. Infrastructure Australia’s March 2025 evaluation expressed ‘low confidence’ in the cost estimate. Tunnelling from the Burwood site began in September 2026.↩
18. ABC News, 13 and 14 December 2025: the West Gate Tunnel opened on 14 December 2025 at $10.2 billion against an initial $5.5 billion contract and a 2014 election promise of $500 million; the state’s contribution rose from $400 million to at least $4.2 billion. North East Link: the Victorian Government’s 2023 revised estimate of about $26 billion.↩
19. Melbourne Water storage history: the system fell to about 26 per cent in mid-2009. Demand: Melbourne Water and the metropolitan retailers, annual water outlooks; Department of Energy, Environment and Climate Action, Target 150.↩
20. Department of Energy, Environment and Climate Action, ‘Desalination’ (water.vic.gov.au, updated June 2026): water orders since 2016–17 of 50, 15, 15, 125, 125, 125, 0, 0, 0, 50 and 150 gigalitres, totalling 505 gigalitres delivered to June 2026, plus 23.9 gigalitres during 2012 commissioning. On the contract and its costs: Victorian Auditor-General’s Office reports on the Victorian Desalination Project, and Public Accounts and Estimates Committee evidence.↩
21. Melbourne Water, Greater Western Water, South East Water and Yarra Valley Water, Melbourne’s Annual Water Outlook 2026 (December 2025) and quarterly updates of March and June 2026; Premier of Victoria and Melbourne Water media releases, 7 April 2026 (150 GL order; storages 67 per cent at end of March, the lowest end-of-summer level since 2020); DEECA, Current Water Snapshot, 3 September 2026 (Melbourne storages 69 per cent).↩
22. Yarra River Protection (Wilip-gin Birrarung murron) Act 2017 (Vic), Preamble and s. 5; Burndap Birrarung burndap umarkoo — Yarra Strategic Plan (2022). On the contrast with legal personhood: Te Awa Tupua (Whanganui River Claims Settlement) Act 2017 (NZ).↩
23. Department of Climate Change, Energy, the Environment and Water (Cth), Environment Protection and Biodiversity Conservation Act 1999 listing for the Natural Temperate Grassland of the Victorian Volcanic Plain (critically endangered, 2008), and species profiles for the striped legless lizard (Delma impar), golden sun moth (Synemon plana), spiny rice-flower (Pimelea spinescens) and growling grass frog (Litoria raniformis).↩
24. Victorian Auditor-General’s Office, Protecting Critically Endangered Grasslands (June 2020); Strategic Audit of the Implementation of Melbourne Strategic Assessment Conservation Outcomes (November 2025), as reported by the Victorian National Parks Association; ABC News, 17 July 2023, on the $92 million compensation ruling, at which point 2,691 of 15,000 hectares had been acquired; VNPA, 24 February 2025, on the Mount Cottrell clearing. On offsets: Sarah Bekessy et al., ‘The biodiversity bank cannot be a lending bank’, Conservation Letters 3 (2010).↩
25. Melbourne Water, Western Treatment Plant documentation; the plant lies within the Port Phillip Bay (Western Shoreline) and Bellarine Peninsula Ramsar site and is a BirdLife Australia Important Bird Area. Merri Creek Management Committee, established 1989.↩
26. Thami Croeser, RMIT University expert comment, ‘Why trees in suburban Melbourne just got stronger protections’, 19 September 2025.↩
27. Australian Building Codes Board, National Construction Code 2022, Volume Two (7-star energy rating), adopted in Victoria from 1 May 2024. On the performance of the existing stock: CSIRO, Australian Housing Data portal; Lyrian Daniel, Emma Baker, Andrew Beer and Ngoc Thien Anh Pham, Warm, cool and energy-affordable housing policy solutions for low-income renters, AHURI Final Report 338 (2020).↩
28. Tenure: Australian Bureau of Statistics, Census of Population and Housing 2021, Greater Melbourne. Better Renting, Sweaty and Stressed (summer renter research, 2023) and subsequent summer reports. Residential Tenancies (Rental Minimum Standards) Amendment Regulations 2025 (Vic); Department of Energy, Environment and Climate Action, ‘Energy efficiency for rental properties in Victoria’ (energy.vic.gov.au).↩
29. Margaret Loughnan, Nigel Tapper, Thu Phan, Kellie Lynch and Judith McInnes, A spatial vulnerability analysis of urban populations during extreme heat events in Australian capital cities (National Climate Change Adaptation Research Facility, 2013); DELWP, Cooling and Greening Melbourne Interactive Map (2018).↩
30. City of Melbourne, Climate Change Mitigation Strategy to 2050 (2018), and its Climate Active carbon-neutral certification for council operations since 2012; Melbourne Renewable Energy Project (2017–18), which contracted 88 gigawatt-hours a year from the Crowlands wind farm on behalf of the council and thirteen other buyers.↩
Source Note
This article draws on City of Melbourne planning documents — the Urban Forest Strategy, the Urban Forest Visual and the precinct plans of 2024–26 — and on Victorian Government material: Plan for Victoria and its planning amendments, Victoria’s Big Build project documentation, the Auditor-General’s reports on the Suburban Rail Loop and on the Melbourne Strategic Assessment, and the Melbourne water corporations’ annual and quarterly water outlooks. The climate science foundation is the Bureau of Meteorology’s station data and the CSIRO–Bureau State of the Climate series. Heat mortality rests on Coates et al. (2014), the Victorian Chief Health Officer’s assessments of the 2009 and 2014 heatwaves, and Zhao et al. (2021) for the global frame. Research from RMIT’s Centre for Urban Research and Australian Urban Observatory, Monash University and the University of Melbourne provides the spatial analysis of heat, canopy and transport disadvantage. Australian reporting — the ABC, The Age, The Guardian Australia and the local papers of the City of Melbourne’s precincts — provides the record of programme delivery and its gaps. The article does not rely on tourism or liveability-ranking material as evidence. It was revised in September 2026 to reflect the January 2026 heatwave, the opening of the Metro Tunnel and West Gate Tunnel, the August 2026 Suburban Rail Loop audit, the 2025–26 water outlooks, the 2025 canopy and rental regulations, and the November 2025 grasslands audit.
Further Reading / Watching / Listening
Reading: Graeme Davison, Car Wars: How the Car Won Our Hearts and Conquered Our Cities (Allen & Unwin, 2004) — the essential history of Australian cities and the car, with Melbourne at its centre. Libby Robin, Defending the Little Desert: The Rise of Ecological Consciousness in Australia (Melbourne University Press, 1998) — the environmental politics that produced Victoria’s conservation frameworks. Richard Broome, Aboriginal Victorians: A History Since 1800 (Allen & Unwin, 2005) — the country the city displaced. Bill Gammage, The Biggest Estate on Earth: How Aborigines Made Australia (Allen & Unwin, 2011) — for the managed grassland landscape the settlers mistook for wilderness. The City of Melbourne’s Urban Forest Strategy and precinct plans, free online, remain models of transparent environmental reporting.
Watching and browsing: The ABC’s documentary Inside the Firestorm (2009) remains the most humane account of Black Saturday. The Australian Urban Observatory (auo.org.au) lets a reader map, suburb by suburb, the disparities in canopy, heat, transport access and income this article describes. The City of Melbourne’s Urban Forest Visual shows every public tree in the municipality with its life expectancy, and still takes email.
Listening: Schwartz Media’s 7am provides the most consistent critical audio journalism on Victorian planning and infrastructure politics. The Wurundjeri Woi-wurrung Cultural Heritage Aboriginal Corporation publishes audio and video on the Birrarung that gives context unavailable in the planning literature.
Download a copy of Melbourne, Australia: The Liveable City Under Heat Stress with my compliments- Kevin J Parker – Publisher