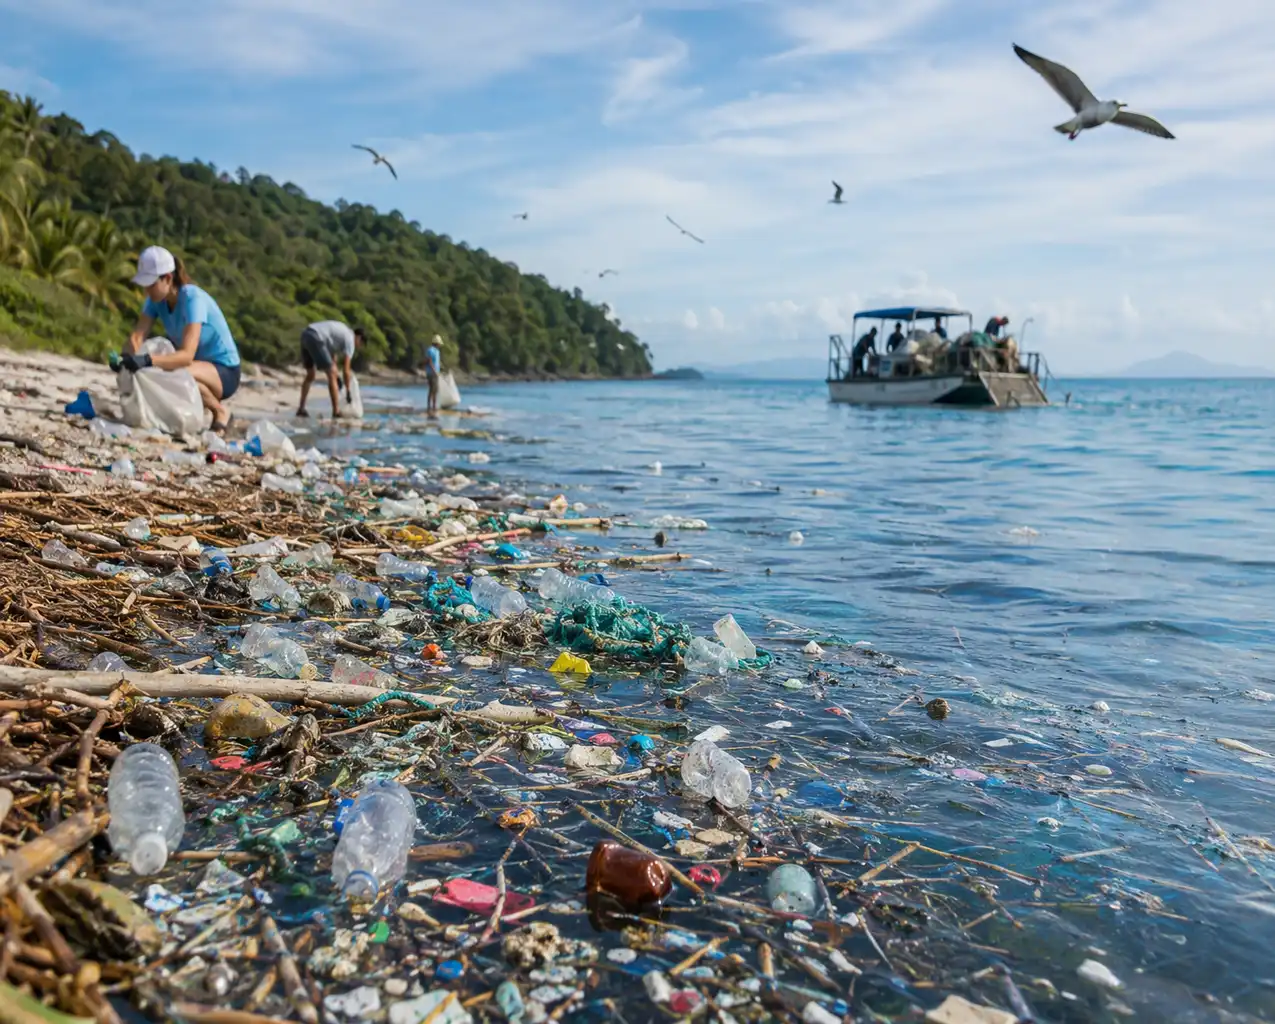

Special Investigation — Planetary Crisis & Ecology
Australian beaches carry 39 per cent less plastic than they did a decade ago. That single number — measured, peer-reviewed, unglamorous — tells us more about the future of the oceans than any photograph of a floating barrier ever will.
There is a particular kind of environmental story that has become almost impossible to tell honestly. It begins with a dead albatross, moves through a statistic about garbage trucks, and ends in a shrug.
This is not that story. The evidence assembled here points somewhere less comfortable and considerably more useful: plastic pollution is one of the very few planetary problems where the interventions are working, the trend lines in some places have already bent, and the remaining obstacle is political rather than technical.
That is genuine good news. It is also, as this investigation will show, contingent, uneven, and easy to squander.
How Much Plastic Is in the Ocean? Reading the Numbers Honestly
Start with production, because everything downstream is a fraction of it. Global plastics production and use reached roughly 435 million tonnes in 2020, up from 234 million tonnes at the turn of the century, and crossed 400 million tonnes of annual output on most industry measures by the middle of this decade.1
Of everything humanity has ever made from polymers — some 8.3 billion tonnes by the most-cited audit — around nine per cent has been recycled and twelve per cent incinerated. The remaining four-fifths sits in landfill or in the open environment.2
The leakage figure is where the reporting usually goes wrong. The OECD estimates that about 22 million tonnes of macro- and microplastics escaped into the environment in 2019, of which roughly 6 million tonnes reached aquatic systems.3 The UN Environment Programme’s global assessment puts inputs to aquatic ecosystems higher, at 19 to 23 million tonnes a year.4
A 2025 modelling study in Science Advances went further still, estimating land-to-sea transport at around 14 million tonnes annually — four to nine times the OECD’s figure — and putting the total marine plastic pool at 263 million tonnes.5
These are not competing errors. They measure different things at different boundaries with different assumptions. But the spread matters, and any article that gives you one tidy number is hiding the argument rather than reporting it.
Exhibit 01 — Flow analysis
The plastic budget: from factory gate to open water
Sources: OECD Global Plastics Outlook (2022); UNEP (2021); Kawecki et al., Science Advances (2025). Waste-generation figure is an OECD-derived estimate for the early 2020s.
Where Does Ocean Plastic Come From? The Thousand-River Problem
The single most consequential finding in this field is not about the ocean at all. It is about rivers.
Research published in 2021 established that roughly 1,000 rivers — about one per cent of the world’s rivers by count — carry an estimated 80 per cent of the plastic flowing from land into the sea.6 Small urban waterways in rapidly growing coastal cities do far more damage than the great continental systems.
This reframed the entire problem. A crisis that had looked planet-sized and shapeless turned out to have addresses.
The rest of the inflow is a longer list: coastal dumping, storm runoff carrying kerbside litter through drains, industrial pellet loss and abandoned fishing gear.
Then there is the fraction that never takes a recognisable form at all. Tyre wear particles shed onto road surfaces and washed into stormwater. Synthetic textile fibres released by domestic washing machines. Paint fragments from hulls and infrastructure. Pre-production pellets — nurdles — spilled during handling at port.
These microplastic streams matter disproportionately because no barrier, boom or conveyor can catch them. They arrive already too small to intercept, which places them entirely beyond the reach of every technology described in this article.
Estuaries are where the two worlds meet, and where the damage concentrates. Tidal reaches trap debris in sediment and mangrove root systems, expose it to sustained ultraviolet weathering and mechanical abrasion, and act as nurseries for the juvenile fish most vulnerable to ingestion. An estuary is not a pipe carrying plastic to the sea. It is a reactor that turns macroplastic into microplastic before releasing it.
Australia’s contribution follows the same pattern in miniature. Three-quarters of the rubbish found on Australian coasts is plastic, and the most common items recorded in the latest national survey were polystyrene fragments and cigarette butts — not, as the popular imagination has it, straws and six-pack rings.7
Exhibit 02 — Source concentration
One per cent of rivers, eighty per cent of the problem
Source: Meijer et al., Science Advances (2021). The finding superseded an earlier consensus that a handful of very large rivers dominated emissions.
What Plastic Does to Marine Life — and to Us
The biological case is now overwhelming, and it has widened dramatically in scope over three decades.
A 2020 review documented entanglement or ingestion across 914 marine species. Plastic had been found in the digestive tracts of all seven species of marine turtle, more than half of marine mammal species, and 44 per cent of seabird species.8 A broader WWF synthesis counting all forms of encounter — ingestion, entanglement, smothering and colonisation — puts the figure above 2,100 species.9
Fish tell the same story with a trend attached. Analysis of nearly 172,000 individual fish across 555 species found plastic in 386 of them, including 210 of commercial importance, with an overall ingestion incidence of 26 per cent — a rate that has roughly doubled over the past decade.10
Two mechanisms compound. Macroplastics kill by blockage, starvation and constriction. Microplastics — the fragments that emerge as larger items weather and shear apart — carry adsorbed industrial chemicals into tissue and move upwards through food webs into species that humans eat.
I want to be careful here, because this is where environmental writing most often over-reaches. The ecological harm is documented beyond serious dispute. The human health consequences of dietary microplastic exposure remain an active area of research where the honest answer is that we have strong mechanistic concern and incomplete epidemiology.
The reported death tolls are almost certainly undercounts, for a mundane reason: most animals that die at sea sink, and are never found or tallied.
Ocean Extraction: What the Floating Arrays Have Actually Achieved
The most photographed intervention is the open-ocean array — a U-shaped barrier towed slowly between two vessels, using the ocean’s own currents to funnel floating debris into a retention zone before it is hauled to port for sorting.
One clarification is necessary, and it matters for anyone writing about this. The large-scale ocean array operates in the Great Pacific Garbage Patch, in international waters between Hawaii and California — not off the Australian coastline. The patch itself is estimated to hold on the order of 100 million kilograms of floating plastic.11
The engineering is genuinely careful. Slow tow speeds, escape routes beneath the barrier and monitored extraction protocols are designed so that pelagic species and marine mammals pass through or below the apparatus rather than into it.
The results are real and worth stating plainly. The Ocean Cleanup removed more than 25 million kilograms of trash from aquatic environments in 2025 alone, taking its cumulative total past 45 million kilograms; by mid-2026 that figure exceeded 53 million kilograms across ocean and river operations combined.12
And now the arithmetic that most coverage omits.
Exhibit 03 — Scale check
Thirteen years of extraction against one year of inflow
Sources: The Ocean Cleanup operational totals (2025–2026); OECD (2022); Kawecki et al. (2025). Extraction figure covers all trash, not plastic alone.
Cumulative removals across thirteen years amount to something under one per cent of what enters aquatic systems in a single year. A 2025 assessment weighing the ecological risks of the towed systems themselves against the harm caused by the plastic concluded there was a net environmental benefit — while flagging real uncertainty in that judgement.13
Extraction is worth doing. It is not the answer. Anyone who tells you otherwise is selling something, and increasingly what they are selling is an offset.
Stopping Plastic Upstream: Interceptors, Bubble Barriers and City-Scale Design
The more consequential engineering happens far from the open ocean.
Solar-powered interceptor barges, moored at river mouths and anchored against the current, use conveyor systems to lift debris out of the water before it ever reaches the sea. Deployments now span rivers in multiple countries, from Southeast Asia to Jamaica and Panama.14
The description of these vessels as “zero-emission” deserves a caveat. Operation is solar-powered; manufacture, shipping, installation and waste haulage are not. The lifecycle footprint is modest and defensible, but it is not zero.
In European canals and estuaries, pneumatic bubble barriers take a different approach. Compressed air pumped through a perforated tube laid diagonally across the riverbed raises a curtain of bubbles that pushes plastic toward one bank for collection — without blocking shipping or impeding fish passage.
The most important shift, though, is conceptual. Interception programmes have begun moving from single machines at single river mouths toward whole-city waste systems: collection, sorting, disposal and the drainage infrastructure that feeds the river in the first place. That is a slower, less photogenic and considerably more durable form of intervention.
Can Enzymes Break Down Plastic? The Biochemical Frontier
Engineered enzymes derived from plastic-consuming bacteria can depolymerise polyethylene terephthalate — the polymer in drink bottles and polyester textiles — back into its chemical building blocks, allowing genuinely closed-loop recycling of coloured, opaque and multilayer material that mechanical recycling cannot handle.
The flagship commercial plant, at Longlaville in eastern France, is designed to process 50,000 tonnes of prepared PET waste a year in a joint venture representing around €230 million of investment.15
It is also behind schedule. Construction was delayed by funding uncertainty, the timeline was formally revised in 2025, and full operation is now expected around 2027.16
This is what a promising technology looks like at the awkward stage between laboratory proof and industrial reality. The chemistry works. The financing is the hard part — which is a pattern worth remembering when the next breakthrough is announced.
Australia’s Quiet Success Story: A 39 Per Cent Fall
Here is the finding that should reorganise how this subject is reported.
Between 2022 and 2024, CSIRO researchers conducted 1,907 surveys across coastal, riverine and inland sites within 100 kilometres of six Australian urban centres, recording 8,383 individual items of debris. Comparing the results against equivalent surveys a decade earlier, they found a 39 per cent decrease in coastal plastic pollution — and a 16 per cent increase in the proportion of surveyed areas with no debris at all.17
No new technology produced that result. It came from container refund schemes, plastic bag bans, improved municipal waste management, community clean-ups and sustained public education.
The mechanism is almost embarrassingly simple. Container deposit legislation has been shown to reduce eligible beverage containers in the coastal environment by up to 40 per cent.18 As CSIRO’s Denise Hardesty has put it, when we put a price on items, they stop being lost to the environment at the same rate.
The distribution of that success is instructive, and CSIRO did not hide it. Debris density fell in Newcastle, Perth and the Sunshine Coast — and rose in Hobart and Port Augusta. Hobart, which recorded the highest occurrence of beverage bottles and bottle fragments, had no container deposit scheme in place at the time of the survey.19
Higher debris densities also correlated with intensive land use and with socio-economically disadvantaged areas — a finding that quietly relocates a chunk of this problem from consumer virtue to infrastructure equity.
Exhibit 04 — Distribution of a national result
A 39 per cent fall — but not everywhere
Source: CSIRO, “Drivers of environmental debris in metropolitan areas: a continental scale assessment,” Marine Pollution Bulletin (2025).
CSIRO’s Ending Plastic Waste Mission targets an 80 per cent reduction in plastic entering the Australian environment by 2030.20 On current evidence that is ambitious rather than fanciful — which, for an environmental target, is a rare thing to be able to write.
The Global Plastics Treaty: The One Piece Still Missing
Everything above happens without a binding international framework. That absence is now the central obstacle.
Negotiations toward a legally binding instrument on plastic pollution began in late 2022 under a UN Environment Assembly mandate covering the full lifecycle of plastic — production, design and disposal. The fifth session in Busan in late 2024 failed to reach agreement. So did the resumed session in Geneva in August 2025, foundering on the same fault line: whether the treaty should constrain production, or confine itself to waste and recycling.
The chair resigned in October 2025. Negotiations stalled entirely. A one-day session in Geneva on 7 February 2026 elected Julio Cordano of Chile as the new chair; no substantive negotiation took place.21
A 2026 roadmap now schedules regular heads-of-delegation meetings, an in-person session in Nairobi in mid-2026, and a full negotiating round — INC-5.4 — in late 2026 or early 2027. There is still no single draft treaty text.22
Writing in Nature in February 2026, researchers argued the deadlock is structural rather than terminal: procedural reform, particularly around consensus rules that allow a small bloc to block progress indefinitely, could still deliver an agreement.23
Meanwhile regional instruments carry the load. The EU’s Single-Use Plastics Directive and extended producer responsibility regimes in a growing number of jurisdictions compel manufacturers to internalise end-of-life costs — the same “polluter pays” logic that underpins Australia’s container refund schemes, operating at continental scale.
Who Pays? ESG Money, Plastic Credits and the Offset Problem
The financing of ocean clean-up has changed character entirely in a decade. What was once philanthropic and marginal is now embedded in corporate environmental, social and governance strategy, with multinationals funding recovery vessels and interception programmes directly.
This is, on balance, a good thing. Sustained capital is what turns a prototype into an operation, and the interception network now spanning rivers on several continents exists because somebody underwrote it.
But a specific mechanism deserves scrutiny: the plastic credit. Under these arrangements, a company funds the recovery of a tonnage of plastic equivalent to what it puts into the market, and claims a neutral or negative footprint as a result.
The logic is borrowed wholesale from carbon offsetting, and it inherits carbon offsetting’s central weakness. A credit purchased against recovered debris does not reduce production. It licenses it — while transferring the moral accounting to a barge in a river delta several thousand kilometres from the boardroom.
Extended producer responsibility works differently, and the distinction is worth holding onto. EPR forces the manufacturer to carry the end-of-life cost of its own packaging, which changes the economics of designing that packaging in the first place. Credits let a manufacturer buy absolution for a design decision it never has to revisit.
One reshapes the product. The other reshapes the disclosure. Only the first is prevention.
What the Evidence Actually Supports
If you strip away the imagery and rank interventions by the strength of evidence behind them, a clear hierarchy emerges — and it is close to the inverse of the attention each receives.
Exhibit 05 — Evidence ranking
What works, ranked by strength of evidence
Assessment by the author, drawn from the sources cited throughout this article.
The Verdict: Hope Is a Discipline, Not a Mood
The temptation in a story like this is to end on the floating array — the drone shot, the swelling music, the tonnage counter ticking upward.
The better ending is a survey team walking a transect on a Newcastle beach, counting cigarette butts, and finding fewer of them than there were ten years ago.
Because that is what the evidence actually says. Plastic pollution is not an intractable planetary condition. It is a waste-management failure with identifiable sources, measurable flows and interventions whose effectiveness has now been demonstrated in the field. Where those interventions have been applied consistently, the numbers have moved — 39 per cent in a decade, across an entire continent’s populated coastline.
What remains missing is not ingenuity. It is a binding global agreement on production, and the political will to stop treating clean-up as a substitute for prevention.
In June 2026, 2,770 volunteers across 46 clean-ups in 17 countries removed just over 30 tonnes of debris in a single weekend.24 Measured against 14 million tonnes a year, it is nothing. Measured as evidence that hundreds of thousands of people will act when given a mechanism, it is everything.
The tide is turning. Slowly, unevenly, and only where someone decided to turn it.
A note on the numbers in this article
Every figure here is drawn from a named source and given with its uncertainty intact. Where estimates conflict, both are shown rather than averaged into false precision. Where per-region magnitudes were not published, the infographics say so rather than inventing a value.
This is deliberate. The credibility of environmental reporting rests on being right about the small numbers when nobody is checking.
Resources and Further Reading
- The Ocean CleanupOcean array and river interceptor operations; published extraction data and peer-reviewed research.
- CSIRO — Ending Plastic Waste MissionAustralia’s national research programme; target of an 80% reduction in plastic entering the environment by 2030.
- UNEP — Intergovernmental Negotiating Committee on Plastic PollutionOfficial treaty negotiation documents, session reports and the current roadmap.
- UNEP — From Pollution to Solution (2021)Global assessment of marine litter and plastic pollution.
- OECD — Global Plastics OutlookEconomic drivers, environmental impacts and policy scenarios to 2060.
- Meijer et al. (2021) — riverine plastic emissionsThe study establishing that ~1,000 rivers carry 80% of land-to-sea plastic flow.
- CSIRO researchers on the 39% declinePlain-language account of the national survey by the authors themselves.
- Ocean ConservancyInternational Coastal Cleanup data and science-based coastal policy advocacy.
- Center for International Environmental LawIndependent legal analysis of the plastics treaty negotiations.
- Einhäupl et al. (2026), NatureHow the global plastics treaty could still be saved: a procedural diagnosis.
Endnotes
- Organisation for Economic Co-operation and Development, Global Plastics Outlook: Economic Drivers, Environmental Impacts and Policy Options (Paris: OECD Publishing, 2022); OECD, “Plastics,” accessed 2026. ↩
- Roland Geyer, Jenna R. Jambeck and Kara Lavender Law, “Production, Use, and Fate of All Plastics Ever Made,” Science Advances 3, no. 7 (2017): e1700782. ↩
- OECD, Global Plastics Outlook: Economic Drivers, Environmental Impacts and Policy Options, fig. 1.2. ↩
- United Nations Environment Programme, From Pollution to Solution: A Global Assessment of Marine Litter and Plastic Pollution (Nairobi: UNEP, 2021). ↩
- “Global Environmental Plastic Dispersal under OECD Policy Scenarios toward 2060,” Science Advances (2025), doi:10.1126/sciadv.adu2396. ↩
- Lourens J. J. Meijer et al., “More than 1000 Rivers Account for 80% of Global Riverine Plastic Emissions into the Ocean,” Science Advances 7, no. 18 (2021): eaaz5803. ↩
- Commonwealth Scientific and Industrial Research Organisation, “Plastic Pollution along Australian Coastlines Decreases by 39 per Cent,” news release, April 2025. ↩
- Susanne Kühn and Jan A. van Franeker, “Quantitative Overview of Marine Debris Ingested by Marine Megafauna,” Marine Pollution Bulletin 151 (2020): 110858. ↩
- WWF, Impacts of Plastic Pollution in the Oceans on Marine Species, Biodiversity and Ecosystems (Gland: WWF International, 2022). ↩
- Matthew S. Savoca et al., “Plastic Ingestion by Marine Fish Is Widespread and Increasing,” Global Change Biology 27, no. 10 (2021): 2188–2199. ↩
- The Ocean Cleanup, Great Pacific Garbage Patch mapping data, derived from Lebreton et al. (2018). ↩
- The Ocean Cleanup, “2025 in Review,” December 2025; subsequent operational totals reported to May 2026. ↩
- Assessment of ecological risk versus benefit of open-ocean extraction systems, published 2025; summarised in contemporaneous reporting. Authors flagged material uncertainty in the finding. ↩
- The Ocean Cleanup, Interceptor deployment record, 2019–2026. ↩
- Carbios, “Carbios Celebrates the Groundbreaking of Its PET Biorecycling Plant,” news release, 25 April 2024. ↩
- Carbios, “2025 Half-Year Results and Revised Timeline,” September 2025. ↩
- “Drivers of Environmental Debris in Metropolitan Areas: A Continental Scale Assessment,” Marine Pollution Bulletin (2025); CSIRO news release, April 2025. ↩
- CSIRO research on container deposit legislation, cited in CSIRO news release, April 2025. ↩
- CSIRO news release, April 2025; see also The Conversation, “Good News, Beach Lovers,” April 2025. ↩
- CSIRO, Ending Plastic Waste Mission, mission statement and targets. ↩
- Center for International Environmental Law, “INC-5.3 Concludes with Election of New Plastics Treaty Negotiation Chair,” 7 February 2026; UNEP, INC on Plastic Pollution, session record. ↩
- UNEP, Chair’s roadmap towards INC-5.4, 2026. ↩
- Paul Einhäupl, Linda Del Savio, Melanie Bergmann and Annika Jahnke, “The Global Plastics Treaty Can Be Saved — Here’s How to Break the Deadlock,” Nature 650 (2026), doi:10.1038/d41586-026-00314-4. ↩
- Oceanic Society, “2026 Global Ocean Cleanup Results,” June 2026. ↩
◆ ◆ ◆
Download a pdf of Ocean-Plastic-Pollution-KJParker