
GREEN CITIES SERIES | ARTICLE 6
London has done something that most cities only talk about: it has used road pricing to change behaviour at scale, and it has used air quality regulation to drive a measurable improvement in the health of nine million people. But the city that built those instruments is also a city of extraordinary contradictions — of one of the world’s finest public transport networks serving a commuter belt of sprawling car dependence, of ambitious climate targets set against a building stock of Victorian and Edwardian construction that will cost hundreds of billions of pounds to decarbonise, and of an environmental leadership whose most consequential tools are wielded, imperfectly, against the wishes of the national government above it and the outer boroughs beside it.
On a Tuesday morning in Marylebone, in the months after the Ultra Low Emission Zone expanded to cover all of Greater London in August 2023, a row of cars that would once have idled in the school drop-off queue outside Broadwick Street Primary is conspicuously absent. The road is quieter than it was. The headteacher reports that the number of children being driven to school has fallen. There is no scientific study yet that quantifies the nitrogen dioxide reduction at this particular junction, but the direction is not in doubt. The children breathing the air here are breathing less of something that, accumulated across the years of their lung development, would have cost them a measurable fraction of their respiratory function.1
This is a small and specific account of a large and general project. The Ultra Low Emission Zone — the ULEZ — is the most ambitious attempt by any city in the world to use financial incentives to remove its most polluting vehicles from its roads. It is not perfect, and its expansion to outer London was among the most ferociously contested political acts of recent London governance. But it is working, in the limited sense that the air quality data confirms and the epidemiological projections support. The question is whether working means enough.
London’s environmental story is, at its most honest, a story about the relationship between what a city knows it needs to do and the rate at which it can politically and financially mobilise to do it. The city has known since the Great Smog of 1952 — the five-day sulphurous fog that killed between 4,000 and 12,000 Londoners and prompted the first Clean Air Act — that air quality is a matter of survival as well as comfort.2 It has known since the first Congestion Charge in 2003 that pricing road use changes behaviour at a scale that exhortation cannot match. It has known, and documented with increasing precision, that its nine-million-person building stock is a carbon catastrophe in waiting: poorly insulated, gas-heated, leaky in winter and sweltering in summer, costing its poorest residents a disproportionate share of their incomes to keep marginally habitable. The gap between knowing and acting is where most of London’s environmental story lives.
A City Made by Its Air and Remade Against It
London’s air quality history is long enough to constitute its own ecological biography. John Evelyn wrote Fumifugium in 1661 — the first serious English treatise on urban air pollution — describing a city so thick with coal smoke that he could not see across the Thames.3 The Industrial Revolution deepened the problem from chronic to acute: the combination of domestic coal burning, factory emissions, and the particular meteorology of the Thames basin — its tendency to trap cold, still air under warmer layers during winter — created the pea-soup fogs of Victorian and Edwardian London that were, despite their cultural romanticism, a significant cause of respiratory disease and excess winter mortality.
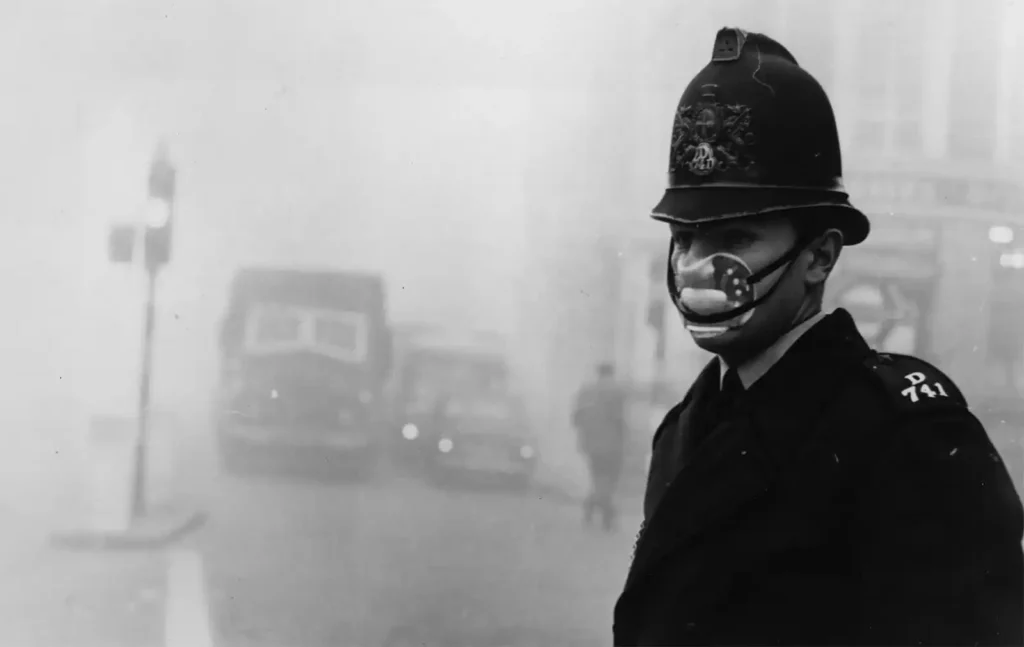
The 1952 Great Smog was the event that finally broke the political resistance to clean air legislation. A weather inversion in early December trapped five days’ worth of emissions from domestic coal fires and industrial chimneys in a layer so dense that visibility in parts of the city fell to a few metres, performances at the Sadler’s Wells Theatre were cancelled because audiences could not see the stage through the fog that had crept under the doors, and cattle at a Smithfield Show died of respiratory failure overnight.4 The immediate death toll was estimated at 4,000 in the weeks following the event; subsequent epidemiological analysis, accounting for those who died of respiratory and cardiovascular disease in the weeks and months after, has revised the figure upward to as many as 12,000. The Clean Air Act of 1956, which established smoke control zones and restrictions on domestic coal burning, directly followed. London’s air improved substantially over the following decades, and the famous London fog — which was never fog but rather industrial and domestic smog — retreated into the city’s mythology.
The improvement was not linear. The shift from coal to natural gas and oil reduced sulphur dioxide and particulate emissions from domestic burning, but the growth of road traffic from the 1960s introduced a new set of pollutants: nitrogen oxides and the secondary aerosol particles formed from them, ground-level ozone, and ultrafine particles from brake and tyre wear that are not captured by engine emission standards. By the 1990s and 2000s, the air quality crisis in London had shifted from smoke to traffic, and its geography had shifted from the industrial riverside and the domestic hearth to the road network — and particularly to the diesel engine, which produces nitrogen dioxide at concentrations substantially higher than petrol vehicles at equivalent energy output.
The geography of that traffic pollution was, and remains, profoundly unequal. The communities most exposed to road traffic emissions in London are overwhelmingly the communities of the inner east, south, and north: Newham, Hackney, Tower Hamlets, Lewisham, Haringey — the boroughs of lower average income, higher proportions of residents from Black and minoritised ethnic communities, older and denser housing stock, and proximity to the arterial roads and lorry routes that serve the ports, logistics centres, and industrial estates of the outer metropolitan area.5 The residents of Kensington and Richmond, whose incomes are higher and whose proximity to the most polluted road corridors is lower, have historically experienced the benefits of London’s proximity to parkland and river and trees while bearing a smaller share of the city’s traffic burden. The ULEZ, the Congestion Charge, and the air quality strategy in their current form are, at least in part, an attempt to correct this geography. Whether they are doing so with sufficient speed, and at sufficient scale, is the central tension in London’s environmental story.
The ULEZ: What Road Pricing Can and Cannot Do
The Ultra Low Emission Zone was introduced in 2019 by Mayor Sadiq Khan, covering the same area as the existing Congestion Charge zone in central London: roughly 22 square kilometres within the inner ring road. It charged non-compliant vehicles — older diesel and petrol cars that did not meet Euro 4 petrol or Euro 6 diesel standards — a daily fee of £12.50 to enter the zone. The 2021 expansion took the ULEZ to the North and South Circular roads, covering roughly 300 square kilometres and encompassing the majority of inner London. The August 2023 expansion to all 32 boroughs and the City of London — covering approximately 630 square kilometres and the full extent of Greater London — was the action that generated the most intense political controversy.6
The opposition to the outer London expansion was organised, vocal, and in some boroughs had the support of local councils. Its arguments were economic — that outer London residents, many of them on modest incomes, relied on older vehicles for work and family journeys that public transport could not serve, and that the £12.50 daily charge constituted a regressive tax on people who had limited alternatives — and political, coalescing around an argument about democratic legitimacy and the reach of mayoral power over decisions that affected residents far from the central London whose environmental benefits were most directly delivered.
The Khan administration’s scrappage scheme — which offered payments of up to £2,000 for eligible London residents to dispose of non-compliant vehicles — was real but inadequate in scale: the number of vehicles eligible for scrappage substantially exceeded the funds allocated, and the residents with the oldest and most polluting vehicles were often those with the fewest financial resources to supplement the scrappage payment with the purchase of a newer, compliant car.7 The political handling of the expansion — which did not sufficiently acknowledge the genuine hardship it imposed on specific categories of outer-London resident, particularly those with mobility limitations and those in areas with demonstrably poor transit connectivity — contributed to the electoral punishment delivered by London voters at the 2024 general election and to the ongoing legal challenges from several outer boroughs.
Against this contested political background, the air quality data tells a story of genuine and measurable improvement. Transport for London’s monitoring network recorded a 21 percent reduction in roadside NO2 concentrations in the original ULEZ zone in its first year of operation, and a further significant reduction following the 2021 expansion.8 The most recent monitoring data covering the outer expansion is still accumulating, but early indications are consistent with the reductions seen in earlier phases: non-compliant vehicle numbers in Greater London fell substantially following the August 2023 expansion, as owners upgraded, scrapped, or moved affected vehicles out of the zone. The fraction of vehicles on London’s roads now compliant with the zone’s standards is substantially higher than before any of the phases was introduced.
The epidemiological significance of these reductions is not abstract. The medical literature on the relationship between NO2 exposure and health outcomes — cardiovascular disease, respiratory illness, preterm birth, childhood asthma, cognitive development — is extensive and consistent. A 2022 analysis by King’s College London’s Environmental Research Group estimated that the reduction in air pollution from the ULEZ’s original zone was associated with approximately 6,000 fewer respiratory hospital admissions and 4,600 fewer cardiovascular hospital admissions over its first three years of operation.9 These numbers represent real people who did not become acutely ill, real costs that were not borne by the NHS, and real years of impaired wellbeing that were not experienced. The charge on non-compliant vehicles is paying dividends in public health that are not visible in the same way that a hospital or a road is visible, but that are, in aggregate, considerably larger.
The Underground, the Bus, and the Limits of the Network
London’s public transport network is, by any comparative measure, one of the finest in the world. The Underground — 272 stations, 11 lines, carrying approximately 1.1 billion passengers per year before the pandemic — gives the city a transit backbone that most comparable metropolitan areas do not have.10 The bus network — the most extensive in Europe, 700 routes, 9,000 buses, covering the entire Greater London area and penetrating corners of the outer city that the rail network does not reach — provides the surface-level connectivity that makes car-free living possible across a much larger proportion of the city than the tube map alone would suggest. The Elizabeth line, opened in 2022 after a decade of construction and years of delays and cost overruns, has added a new east-west rail axis of genuinely transformative capacity: faster, more frequent, and reaching communities in Berkshire, Buckinghamshire, and Essex that previously had significantly longer journeys to central London.
The network has also been the subject of a financial crisis that is not fully resolved. Transport for London entered the COVID-19 pandemic with a funding model dependent on fare revenue to a degree unusual among major world transit agencies: approximately 72 percent of its pre-pandemic operating costs were covered by fares, compared to 38 percent for New York’s MTA and well below 50 percent for most European peers.11 When ridership collapsed in 2020 and 2021, the organisation required emergency bailouts from central government — bailouts that came with conditions on fares, service levels, and the pace of network expansion that have constrained TfL’s ability to invest in the capacity and service improvements that a growing city requires. The funding settlement reached between the Khan and Starmer administrations in 2024 provides more structural certainty than the year-by-year emergency agreements of the pandemic period, but TfL remains more financially precarious than the network’s importance to the city justifies.
The outer London transit problem — familiar from Melbourne, Adelaide, and the other expanding metropolitan areas examined in this series — is real and structural. The London Overground, the Elizabeth line, and the Thameslink network provide reasonable rail connectivity across much of the outer city. But the arterial roads of the outer boroughs — the A roads and B roads of Havering, Hillingdon, Sutton, and the other peripheral boroughs — are served by buses that run infrequently, are subject to traffic congestion on road corridors shared with private vehicles, and cannot provide the journey times that would make car use economically irrational for residents with the choice. The boroughs where the ULEZ expansion was most contested are also the boroughs where the transit alternatives are least competitive with the car. This is not a coincidence.12
Cycling infrastructure has expanded substantially under successive London mayors, and particularly under Khan’s Streetspace programme introduced during the pandemic, which used the temporary reduction in traffic to establish low-traffic neighbourhoods and protected cycle lanes on a number of key corridors.13 The Cycleways programme — branded infrastructure connecting the central city to the inner suburbs along dedicated routes — has produced a measurable growth in cycling volumes on those corridors. But cycling remains, at the city scale, a minority mode: approximately 2.5 percent of all journeys in London are made by bike, a figure that has grown but that remains far below Amsterdam, Copenhagen, or even the inner boroughs of London’s own peer cities. The infrastructure investment is real; the culture change required to make cycling normal for a more representative demographic cross-section of a nine-million-person city is a generation’s work, not a decade’s.
The Building Stock: The Largest and Least Resolved Problem
If clean air is London’s partial success story and congestion charging its contested achievement, the city’s building stock is the problem for which there is no plausible near-term solution at the scale required — only a very long and very expensive process whose political management is among the most difficult challenges in British urban governance.
London has approximately 3.8 million homes. The majority were built before the Second World War.14 A substantial fraction of those — including the Georgian and Victorian terraced houses of the inner boroughs, the Edwardian semis of the inner suburbs, and the interwar housing of the outer ring — have solid brick walls rather than cavity walls, making the standard cavity wall insulation technique unavailable. Their windows are single-glazed or early double-glazed. Their boilers are gas-fired and inefficient. Their thermal performance, measured in energy loss per unit of floor area, is among the worst in northern Europe. The residents of these properties pay high heating bills to maintain temperatures that Scandinavian or German homeowners, in comparably cold climates, achieve at a fraction of the energy cost.
The summer heat problem is becoming as urgent as the winter cold problem. London’s urban heat island — three to four degrees above the surrounding rural temperature on summer nights, reaching six degrees or more in the densest parts of the inner east — is intensifying as the climate warms and as urban expansion reduces the permeable and vegetated surfaces that moderate it.15 Overheating in London homes has been documented in studies by University College London and the Building Research Establishment as a growing public health risk: homes built for northern European heating climates, with south-facing glazing designed to maximise winter solar gain, can reach internal temperatures above 26 degrees for extended periods during summer heat events, particularly in the upper floors of terraced houses and in flats below flat roofs. The 2022 UK temperature records — 40.3 degrees Celsius recorded at Coningsby in Lincolnshire on 19 July, the first time 40°C had ever been measured in Britain — brought this problem into sudden national focus.
The retrofit challenge is complicated by tenure, governance, and the particular economics of the British housing market. Approximately 28 percent of London’s homes are rented privately — a proportion that has grown substantially since the 1980s as the buy-to-let market expanded and as social housing stock was reduced by Right to Buy without replacement.16 Private landlords have, in aggregate, limited incentive to invest in energy efficiency improvements that benefit tenants rather than the landlord’s own comfort or energy bills. The Minimum Energy Efficiency Standards (MEES) regulations — which currently require rental properties to achieve an EPC rating of at least E before being let, and which the government has proposed tightening to C — have been the subject of sustained opposition from the private landlord lobby, and the timetable for their strengthening has been repeatedly delayed. The residents most financially exposed to high heating bills — low-income renters in poorly insulated private rented accommodation — are the residents whose landlords have the least economic incentive to improve.
Social housing presents a different but equally intractable version of the problem. London’s social housing stock — managed by thirty-two borough councils and a large number of housing associations — includes some of the worst-performing buildings in the city’s energy landscape: the large post-war council estates of the 1950s, 1960s, and 1970s, built with prefabricated concrete panels and flat roofs under construction systems now known to have severe thermal bridging and moisture problems, and housing large proportions of the city’s lowest-income residents.17 The Grenfell Tower fire of June 2017 — in which 72 people died in a council-managed tower block in North Kensington whose cladding system, installed during an energy retrofit, proved catastrophically combustible — made building safety the dominant political lens through which council housing is now discussed, and rightly so. But it also created a regulatory and political environment in which building renovation programmes — which are necessary for both safety and energy performance — are now subject to a level of uncertainty and compliance burden that has slowed the pace of the retrofit that is simultaneously urgently needed.
The Mayor of London’s Retrofit Accelerator programme — which provides technical assistance and procurement support to social landlords undertaking large-scale building upgrades — has helped a number of housing providers navigate the cost and complexity of whole-building retrofit.18 The Greater London Authority’s target — to retrofit all social housing to EPC band C or above by 2030 — is ambitious. Progress toward it is not on track. The funding available from the Social Housing Decarbonisation Fund, the UK Shared Prosperity Fund, and the GLA’s own programmes falls well short of the total cost of bringing London’s social housing stock to the required standard. The scale of the financial gap is not publicly stated in a form that makes it easy to hold decision-makers accountable for the shortfall.
The Green City: Parks, Trees, and the Nature Recovery Question
London’s relationship with green space is, by the standards of cities of comparable size and density, genuinely exceptional. The city is covered by approximately 47 percent green and blue space, including the Royal Parks, the commons, the Epping Forest, the Lee Valley, thousands of private gardens, golf courses, playing fields, and road verges.19 The Parks themselves — Hyde Park, Kensington Gardens, Regent’s Park, Greenwich Park, Richmond Park — are in any objective assessment among the finest urban parklands in the world, and they are publicly owned, freely accessible, and within reach by public transport of the vast majority of Londoners. Their ecological quality is variable: the most-visited central parks are managed primarily for human recreation, with mown grass and ornamental plantings dominating; the outer parks and the commons have higher ecological value, with Richmond Park’s ancient oaks supporting invertebrate communities of national significance and its deer herd maintaining the open grassland character that makes it one of the most remarkable urban nature experiences available in any European capital.
The designation of London as a National Park City in 2019 — an informal designation rather than a statutory one, championed by geographer Daniel Raven-Ellison and adopted by Mayor Khan — was a statement of intent rather than a regulatory mechanism.20 Its significance lies in the reframing it encourages: London as a living system deserving the same stewardship ethos as a designated national park, rather than simply as a built environment that contains some parks. The designation has inspired a programme of greening activity, a citizen science network, and a political narrative around London’s biodiversity that has influenced planning decisions in ways its non-statutory status might not predict. Whether it will produce the measurable biodiversity recovery that London’s ecological surveys identify as necessary — more connected green corridors, more native planting, fewer impervious surfaces, more space for the swift, the house martin, and the black-redstart that make the city’s urban ecology distinctive — is yet to be determined.
The Urban Greening Factor — a planning policy tool introduced in the 2021 London Plan that requires new developments to demonstrate a minimum level of green cover, calculated using a formula that weights different types of green space by their ecological and cooling value — is a more structural intervention.21 It requires developers to incorporate green roofs, green walls, planted courtyards, sustainable drainage, and street trees into major development proposals, and it provides a quantitative framework for assessing whether those provisions are adequate before planning permission is granted. Its implementation has been uneven — some boroughs have applied it robustly, others less so — but its existence in the statutory planning framework gives it a durability that mayoral strategies without planning system backing lack. Over the long term, if consistently applied, it will change the character of new development across the city in ways that are ecologically significant.
London’s urban tree canopy — covering approximately 21 percent of the city’s surface area — is distributed unequally in ways that track household income with uncomfortable precision.22 Richmond upon Thames, the city’s most affluent outer borough, has canopy cover approaching 35 percent. Newham, the most deprived inner east London borough, has canopy cover below 9 percent. The disparity is not primarily a function of density — many dense inner-city areas in Paris or Amsterdam have substantially higher canopy cover than comparable areas of east London — but of the long-term effects of different investment priorities, different development patterns, and different levels of political demand for the environmental goods that trees provide.
The Thames Barrier and the Risks Beyond It
The Thames Barrier — the ten steel gates that close across the river at Woolwich to prevent tidal surge flooding of central London — was completed in 1982 and has been closed more than 200 times since.23 In its first decade of operation it was closed on average less than once a year; in 2013-14 it was closed 50 times in a single winter. The increase reflects a combination of sea level rise, increased stormwater runoff from the expanding impervious urban surface, and the greater frequency of the Atlantic storm systems that push tidal surges up the Thames estuary. The barrier was designed to protect London until approximately 2030 under moderate sea level rise scenarios. Under the higher scenarios now considered plausible, its useful life is shorter than that, and the Environment Agency’s Thames Estuary 2100 plan — the long-term flood risk management strategy for the region — is already examining the options for a new or upgraded barrier further downstream.
The flood risk to London is not only tidal. Surface water flooding — the inundation of streets and basements during intense rainfall events, when the volume of water falling on impervious surfaces exceeds the capacity of the Victorian-era combined sewer system — has become a significant and growing hazard as rainfall intensity increases under climate change. The July 2021 flood events, which deluged Tube stations, homes, and roads across south and east London during a single intense storm, were a preview of what the city’s drainage infrastructure will face with increasing frequency.24 The Thames Water drainage network in London is one of the oldest and least adequate in any major European city: the sewers built by Joseph Bazalgette in the 1860s were designed for a London of three million people and are now serving a city of nine million, with an infrastructure replacement programme that is funded through water bills and capital borrowing at a rate that has not kept pace with the system’s deterioration or the city’s growth.
The Tideway Tunnel — the 25-kilometre deep sewer currently under construction beneath the Thames, designed to capture the combined sewage overflows that have periodically discharged raw sewage into the river during heavy rain — is the most significant drainage infrastructure investment in London in a century.25 Its cost, now exceeding £5 billion after delays and inflation, is being recovered through a levy on Thames Water customers’ bills that amounts to approximately £25 per year per household. The tunnel will, when complete, virtually eliminate the CSO discharges that have been a source of ecological degradation in the tidal Thames for decades. Its construction has been a significant disruption to riverside communities and a source of controversy about the allocation of its cost between shareholders, customers, and the public. It is, nonetheless, the infrastructure the city needed.
The Unequal City: Who Gets Clean Air and Who Pays For It
The environmental justice dimension of London’s green transition is structural and persistent. The city’s most ambitious environmental programmes — the ULEZ, the Low Traffic Neighbourhoods, the cycling infrastructure, the green space investment — have disproportionately delivered their benefits to residents who already live in the better-served, better-canopied, better-connected inner London districts, while the costs of transition have been disproportionately borne by outer London residents with older vehicles, worse transit options, and less capacity to absorb the financial demands of compliance.
Low Traffic Neighbourhoods — the modal filters and road closures that prevent through-traffic from using residential streets — were introduced at pace during the pandemic in a number of inner London boroughs, particularly Waltham Forest, Lewisham, and Hackney. The environmental evidence for LTNs is broadly positive: they reduce traffic on filtered streets, improve air quality within the neighbourhood, increase cycling and walking volumes, and reduce road injury rates.26 The political evidence is more complicated: they have been strongly supported by the residents of the streets they protect and strongly opposed by residents and businesses on the arterial roads where displaced traffic concentrates, and by outer-ring communities that feel the policy is being designed by and for inner-London cycling advocates rather than for the full diversity of Londoners. The pattern of support and opposition tracks the city’s political geography — inner Labour-voting boroughs for, outer Conservative-voting boroughs against — in a way that has made the policy a proxy for deeper arguments about whose London is being built.
Fuel poverty — the condition of spending more than ten percent of household income on energy — affects approximately 900,000 London households, concentrated in the outer eastern, northern, and southern boroughs where housing is older, less well insulated, and energy costs are higher relative to income.27 The Warm Homes Local Grant and the Energy Company Obligation (ECO) scheme provide some support for energy efficiency improvements in fuel-poor households, but the means-testing, administrative complexity, and limited funding envelopes of these programmes mean that they reach a minority of the households that qualify. The households with the highest energy costs and the worst housing are, systematically, the households with the least capacity to navigate grant application processes and the least financial resilience to fund the gap between grant support and the full cost of substantive retrofit.
The Governance Gap: Mayor, Boroughs, and Westminster
London’s environmental governance is complicated by a three-way division of authority that generates friction at precisely the points where coordination is most needed. The Mayor of London, elected city-wide, controls Transport for London, the London Plan (which sets strategic planning policy), the Metropolitan Police, the fire service, and the GLA’s economic development functions. The thirty-two borough councils control local planning decisions, local roads, housing management, waste collection, and most of the services that directly shape residents’ daily environmental experience. The national government in Westminster controls the legislative framework within which both operate, including the Clean Air Act, building regulations, energy policy, and the funding streams that determine the financial capacity of both the Mayor and the boroughs.
The tensions within this structure are not incidental. When the Mayor wished to introduce the ULEZ, he required the legal authority conferred by the Greater London Authority Act, which had to be interpreted and in some provisions amended to support the expansion. When outer boroughs wished to challenge the ULEZ expansion, they found grounds in both legal arguments about the adequacy of the scrappage scheme and political arguments about democratic accountability. When the Mayor sets a net-zero target for London by 2030, he is setting a target for activities — building emissions, transport, industry — over some of which he has leverage and some of which he does not. The national government controls building regulations, gas network policy, and the power grid that determines the carbon content of London’s electricity consumption.28
The relationship between the mayoralty and Westminster has been particularly strained over transport funding. The chronic underfunding of TfL relative to comparable transit agencies, the repeated use of emergency funding agreements as a mechanism to extract policy concessions from the Mayor, and the absence of a settled multi-year capital funding commitment for the Underground’s maintenance and renewal programme represent a governance dysfunction whose costs are borne by the nine million people who depend on the network. Cities that manage public transit well — Vienna, Singapore, Tokyo — have in common a political settlement in which the funding of the network is treated as a long-term infrastructure commitment rather than an annual political negotiation.
The Long Work of the Impure City
The children at Broadwick Street Primary are breathing cleaner air than their older brothers and sisters breathed when they were in Reception. The river at Hammersmith has more brown trout than it has had since the 1960s — a consequence of the steady improvement in Thames water quality since Bazalgette’s sewers were extended and the combined sewer overflows progressively reduced. The number of swifts returning to inner London has stabilised after decades of decline, partly because of a programme of swift brick installation in new and refurbished buildings. Richmond Park’s ancient oaks are still standing.
These are not nothing. They are the accumulated result of a century of environmental legislation, political argument, legal challenge, and institutional persistence in a city that has been cleaning up after itself — more slowly than the science requires, more unevenly than justice demands — since John Evelyn complained about the coal smoke in 1661.
But the building stock is still leaking heat into winter air and absorbing solar radiation in summer above the comfort threshold of its most vulnerable residents. The outer boroughs are still poorly served by public transit. The tree canopy in Newham is still a fraction of what it is in Richmond. The Tideway Tunnel is still under construction. The Thames Estuary 2100 plan is a document rather than a structure. The funding settlement for the tube has not been resolved on a timescale that the network’s capital needs require.
London is a city that knows, with unusual precision, what it needs to do. The epidemiology, the climate science, the social research, and the planning literature are all in order. The Mayor’s climate action plan and the London Plan contain more sophisticated environmental ambition than most comparable documents produced by any world city of equivalent size. The instruments — road pricing, air quality zones, urban greening policy, the retrofit programmes — are more developed here than almost anywhere else.
The honest summary is this: London is doing more than most cities its size, it is moving faster than it was, and it is not moving fast enough. The gap between the city’s environmental ambition and the pace of its delivery is not a gap that can be closed by more plans or better strategies. It is a gap that requires a level of public investment, political coordination between the Mayor and Westminster, and redistribution of environmental benefit toward the communities that have borne the greatest burden — that has not yet been politically mobilised at the scale the city’s own documents describe as necessary.
The smog of 1952 cleared eventually, driven by legislation that took years to pass and decades to implement. The air above the school in Marylebone is cleaner today than it was when this article was commissioned. Progress is real. So is the distance still to travel.
Endnotes
1. On the relationship between ULEZ zones and school exposure to road traffic pollution: Impact on Urban Health, ‘ULEZ and Schools: Air Quality at School Gates’ (2022). On the health impacts of NO2 on childhood lung development: Gauderman et al., ‘The Effect of Air Pollution on Lung Development from 10 to 18 Years of Age,’ New England Journal of Medicine (2004) — the study whose findings have been central to the London air quality policy argument.
2. The 1952 Great Smog: Ministry of Health, Mortality and Morbidity during the London Fog of December 1952 (1954). The original official estimate of 4,000 deaths was revised upward by: Bell and Davis, ‘Reassessment of the Lethal London Fog of 1952: Novel Indicators of Acute and Chronic Consequences of Acute Exposure to Air Pollution,’ Environmental Health Perspectives (2001), which estimated 12,000 excess deaths. The Clean Air Act 1956 (UK).
3. John Evelyn, Fumifugium, or The Inconveniencie of the Aer and Smoak of London Dissipated (1661), presented to King Charles II. The text is available in facsimile and is the founding document of the English urban air quality literature. On London’s air quality history: Peter Brimblecombe, The Big Smoke: A History of Air Pollution in London Since Medieval Times (Routledge, 1987).
4. On the 1952 smog’s cultural and social dimensions: Ian Bell, London Was Ours: Diaries and Memoirs of the London Blitz (IB Tauris, 2008) for comparative context on London’s tolerance of atmospheric emergency; and coverage in The Times and Manchester Guardian, December 1952. The Sadler’s Wells incident and the Smithfield cattle deaths are documented in contemporary newspaper accounts.
5. On the unequal distribution of traffic pollution in London by income and ethnicity: Fecht et al., ‘Associations between air pollution and socioeconomic characteristics, ethnicity and age profile of neighbourhoods in England and the Netherlands,’ Environmental Pollution (2017); and Greater London Authority, London Environment Strategy (2018), Chapter 4 (Air Quality), which contains detailed spatial analysis of pollution exposure by deprivation index.
6. ULEZ legislative history and zone expansions: Transport for London, ULEZ Scheme Order (2019); GLA, ULEZ Expansion Consultation documents (2020, 2022). The charge at time of writing is £12.50 per day for non-compliant vehicles. The August 2023 expansion to Greater London is documented in TfL’s ULEZ Expansion: Equalities Impact Assessment (2023).
7. ULEZ scrappage scheme: Transport for London, ULEZ Scrappage Scheme — Eligibility and Payments documentation (2023). On the adequacy debate: London Assembly Transport Committee report on the scrappage scheme (2023); and investigative reporting by The Guardian and The Times on the gap between eligible vehicles and available funding.
8. Air quality monitoring results post-ULEZ introduction: King’s College London, Environmental Research Group, London Air Quality Network data. The 21% reduction in roadside NO2 in the original ULEZ zone in 2020 is from: TfL, ULEZ First Year Report (2020). Subsequent expansion impact data: TfL, ULEZ Monitoring and Evaluation (2022).
9. Health impact assessment: Mudway et al., ‘Impact of the introduction of the London Ultra Low Emission Zone on air quality and health,’ The Lancet Public Health (2023). The figures on respiratory and cardiovascular hospital admissions are from this analysis, conducted by researchers at King’s College London, Imperial College London, and University College London.
10. London Underground statistics: Transport for London, Travel in London reports, multiple years. Pre-pandemic ridership of approximately 1.1 billion annual passenger journeys is from TfL Travel in London Report 12 (2019). Network statistics (272 stations, 11 lines) from TfL network data.
11. TfL fare revenue dependency: National Audit Office, Financial Sustainability of Transport for London (2021). The 72% fare recovery ratio is from pre-pandemic TfL financial accounts (2018–19). Comparative figures for other transit agencies from: International Association of Public Transport (UITP), Urban Public Transport Statistics (2019).
12. Transit coverage in outer London boroughs: TfL, Public Transport Accessibility Level (PTAL) mapping, which scores all London addresses on a scale of 0–6b. Large proportions of Havering, Hillingdon, and Bromley score 0–2 (very poor to poor accessibility). On the relationship between PTAL and ULEZ opposition: analysis by Centre for Cities, ‘ULEZ and Transit Accessibility’ (2023).
13. London cycling investment and Streetspace programme: TfL, Cycling and Walking Investment Strategy (2018) and Streetspace for London programme documentation (2020). On cycling modal share: TfL Travel in London Report 15 (2022), which records 2.5% of journeys by bicycle. On growth in cycling volumes on Cycleway corridors: TfL cycling count data, published annually.
14. London housing stock age profile: Ministry of Housing, Communities and Local Government, English Housing Survey (2022–23). The proportion of London’s housing stock built before 1945 is approximately 38%; pre-1980 construction accounts for approximately 75% of the total. Total homes in London: approximately 3.8 million (GLA London Housing Research Q4 2023).
15. London urban heat island: Watkins et al., ‘Increased temperature and intensification of the urban heat island: implications for human comfort and urban design,’ Built Environment (2002); and updated analysis in: GLA, London Climate Change Adaptation Strategy (2021). The 40.3°C UK record on 19 July 2022: Met Office, UK Record Temperatures documentation.
16. Private rented sector proportion: English Housing Survey (2022–23). The growth of buy-to-let from the 1980s and the reduction of social housing through Right to Buy: Anne Power and Katharine Mumford, The Slow Death of Great Cities? Urban Abandonment or Urban Renaissance (York Publishing, 1999) for historical context; updated by Shelter’s annual housing research.
17. Post-war council housing energy performance: Building Research Establishment, English Housing Survey Data on Energy Efficiency by Tenure and Dwelling Type (2022). On non-traditional construction systems and thermal bridging: BRE, Assessment of Non-Traditional Housing Defects (multiple editions). On the Grenfell Tower fire: Grenfell Tower Inquiry, Phase 2 Report (2024).
18. GLA Retrofit Accelerator programme: Greater London Authority, Retrofit Accelerator — Homes programme documentation. GLA target on social housing retrofit: London Environment Strategy (2018), updated in Mayor’s Environment and Energy Strategy commitments. On the Social Housing Decarbonisation Fund: DESNZ (Department for Energy Security and Net Zero) programme documentation and allocation data.
19. London green and blue space coverage: Natural England and GLA analysis of London’s land cover. The 47% figure is from the GLA’s Green Infrastructure Focus Map and is consistent with satellite land cover analysis. On the Royal Parks’ ecological character: Royal Parks, Biodiversity Action Plans, multiple editions.
20. London National Park City designation: Daniel Raven-Ellison, National Park City Foundation, campaign and designation documentation (2019). On the designation’s planning and governance implications: UCL Urban Laboratory, ‘National Park City: What Does It Mean for London?’ (2020).
21. Urban Greening Factor: Greater London Authority, London Plan 2021, Policy G5. Technical methodology: GLA, Urban Greening Factor for London: Guidance for Applicants and Planners (2021). On implementation consistency across boroughs: London Assembly Planning Committee, monitoring report (2023).
22. London tree canopy cover by borough: GLA, i-Tree Eco London survey (2015, updated 2021) — the most comprehensive assessment of London’s urban forest, conducted by Trees for Cities and Forest Research. Richmond’s 35% and Newham’s 9% canopy figures are from this dataset. On canopy inequality and income correlation: Chen et al., ‘Urban greenspace is associated with reduced posttraumatic stress disorder symptoms among veterans,’ Ecological Applications (2015); and GLA analysis of canopy data by Index of Multiple Deprivation.
23. Thames Barrier closure statistics: Environment Agency, Thames Barrier Operations data, published annually. 200+ closures since 1982 figure is from EA operational records. The 50 closures in winter 2013–14 is documented in EA Thames Estuary reports. On the Barrier’s design life: EA, Thames Estuary 2100: Managing flood risk through London and the Thames estuary (2012).
24. July 2021 London flooding: EA Flood Incident reports; London Assembly Environment Committee, Report on Surface Water Flooding in London (2021). On the Victorian sewer system capacity: Thames Water, Surface Water Management Plan; and OFWAT infrastructure assessment reports.
25. Tideway Tunnel (Thames Tideway Tunnel): Bazalgette Tunnel Ltd, project documentation and cost reports. The £5 billion-plus cost figure is from updated project assessments as of 2023–2024. On the customer bill levy: OFWAT, Thames Tideway Tunnel Infrastructure Provider determination. The tunnel, when complete, will capture an estimated 96% of CSO discharges to the tidal Thames.
26. Low Traffic Neighbourhood evidence: Laverty et al., ‘Low Traffic Neighbourhoods, Car Use, and Active Travel,’ Journal of Transport and Health (2021); and commissioned research by the London School of Hygiene and Tropical Medicine for the GLA. On LTN political geography and opposition: Centre for London, ‘Low Traffic Neighbourhoods: The Politics and the Evidence’ (2022).
27. Fuel poverty in London: DESNZ, Sub-regional Fuel Poverty Data (England) 2024, using the Low Income Low Energy Efficiency (LILEE) definition. Approximately 900,000 London households in fuel poverty is from this dataset. On ECO scheme reach: Ofgem, Energy Company Obligation evaluation reports.
28. On the division of environmental authority between the Mayor, boroughs, and Westminster: Greater London Authority Act 1999 (as amended); and GLA, Understanding the Mayor’s Powers (2021). On the London Plan as a statutory instrument: Town and Country Planning Act 1990 and Planning and Compulsory Purchase Act 2004, which establish the GLA’s strategic planning function.
Source Note
This article draws on Transport for London monitoring and evaluation reports, the Greater London Authority’s London Environment Strategy and London Plan (2021), and King’s College London’s Environmental Research Group — which produces the most rigorous ongoing air quality science for London. Building stock data comes from the Ministry of Housing, Communities and Local Government’s English Housing Survey. Thames flood risk information draws on the Environment Agency’s Thames Estuary 2100 framework and Tideway Tunnel project documentation. The GLA’s i-Tree Eco London survey provides the urban forest data. Academic sources include research from UCL, Imperial College London, King’s College London, and the London School of Hygiene and Tropical Medicine. Investigative journalism from The Guardian, The Times, The Independent, the London Assembly’s committee reports, and the Centre for London’s policy research provides critical assessment of programme delivery. Historical sources include Peter Brimblecombe’s air quality history and John Evelyn’s original Fumifugium. This article does not use promotional or tourism material as evidential sources.
Further Reading / Watching / Listening
Reading: Peter Brimblecombe, The Big Smoke: A History of Air Pollution in London Since Medieval Times (Routledge, 1987) — essential on the long arc of London’s air quality history. John Evelyn, Fumifugium (1661) — brief and still startlingly readable; the founding text. Lynsey Hanley, Estates: An Intimate History (Granta, 2007) — the most humane account of what council housing means to its residents, and the best available background for understanding the retrofit and energy poverty problem. Anna Minton, Ground Control (Penguin, 2012) — on the privatisation of London’s public realm, a necessary counterweight to the greening narratives. For the Thames: Jeremy Paxman, Fish, Fishing and the Meaning of Life (Michael Joseph, 1994) — not a conservation text, but its account of the Thames’s ecological recovery offers the kind of lived evidence that data cannot.
Watching: Channel 4’s Dispatches and the BBC’s Panorama have both produced documentary investigations into London’s air quality and the ULEZ controversy that are more analytically rigorous than most broadcast journalism on urban environmental topics. For the housing context: the BBC’s coverage of the Grenfell Tower Inquiry, particularly the Phase 2 findings in 2024, is essential viewing for anyone seeking to understand the relationship between building safety, energy retrofit, and social housing governance. The London Assembly’s livestreamed committee hearings on air quality and climate are publicly available via the GLA website and provide the most direct access to the political decision-making examined in this article.
Listening: The Guardian’s Today in Focus podcast has covered ULEZ, LTNs, and London housing in depth. The Centre for London’s podcast series provides the best policy-focused audio analysis of London’s environmental governance. BBC Radio 4’s Costing the Earth programme — the longest-running environmental radio programme in British broadcasting — regularly covers London-specific as well as national and international environmental topics, and its archive contains important historical coverage of clean air legislation, the Congestion Charge’s introduction, and the Thames Tideway Tunnel.