
Oceans · El Niño · Climate
A Record Out of Season
The ocean just forgot what month it is. El Niño, a warming sea, and what the hottest water ever measured means for the year ahead.
This piece responds to, and draws its starting point from, the ABC News report “Ocean temperatures hit ‘very troubling’ record high” (Associated Press via ABC, 25 August 2026). With thanks to the ABC and AP for the reporting.
On Tuesday morning the ABC carried a wire story with a very large number folded into a very short piece. Under the headline Ocean temperatures hit ‘very troubling’ record high, Associated Press copy reported that the surface of the world’s ocean had reached 21.1 degrees Celsius on Friday and Saturday, the warmest reading in a record that runs back to 1979.1 The report is brief, sober and worth reading in full. What follows is an attempt to do what a news wire cannot: explain where the number came from, why its timing matters more than its size, and what it tells us about the year ahead.
Start with the calendar.
A record out of season
The ocean keeps a calendar of its own, and it is a southern one. Most of the planet’s water lies below the equator, so the global sea surface warms as the austral summer runs its course and reaches its annual high in March or April, when the light has already begun to leave the Southern Ocean and the Tasman is still holding the heat of February. Then it cools. August is the long slide towards the trough, not the crest.
Not this year. On 21 and 22 August, 2026, the daily average temperature of the world’s non-polar ocean surface, the belt between 60 degrees north and 60 degrees south, reached 21.104 degrees. That edged the previous record of 21.09, set in March 2024, by a whisker. It beat the previous August high, 20.98 degrees in 2023, by rather more. It sat about 0.67 degrees above the 1991–2020 average for the date, the widest gap of the year so far.2
Samantha Burgess, who leads climate strategy at the European Centre for Medium-Range Weather Forecasts, called it “another clear signal of an ocean under growing stress”.2 Jane Lubchenco, the marine ecologist who ran America’s oceanic agency under Barack Obama, put it more bluntly to the AP: a warmer ocean is not our friend.1
The figure itself — a fraction of a degree, in water most swimmers would call bracing — is not the story. The story is the date. A record set in March is the ordinary top of an ordinary curve nudged upward. A record set in August, in the season of decline, means the whole curve has lifted off its bed.
The child and the fishermen
To understand why, you have to go to Peru.
For well over a century the fishermen of Paita and Callao have known that, in some years, a tongue of warm water arrives off their coast around Christmas and the anchovies vanish. They named it for the season: El Niño, the Christ child. In the worst years the warm water lingered for months and brought rain to a desert that sees almost none; the fishing collapsed, the seabirds starved and the guano islands fell silent.3
The fishermen were watching one end of a see-saw that spans the largest ocean on Earth. The other end was found in the 1920s by Gilbert Walker, a British mathematician running the Indian meteorological service, who noticed that when atmospheric pressure was high over Tahiti it tended to be low over Darwin, and the reverse. He called the pattern the Southern Oscillation and could not explain it. It took until 1969 for the meteorologist Jacob Bjerknes to join the two halves: the warm water off Peru and the pressure swing across the Pacific were a single phenomenon, ocean and atmosphere pushing on each other. Today we call it ENSO, the El Niño–Southern Oscillation, and it is the largest natural source of year-to-year variation in the world’s climate.3
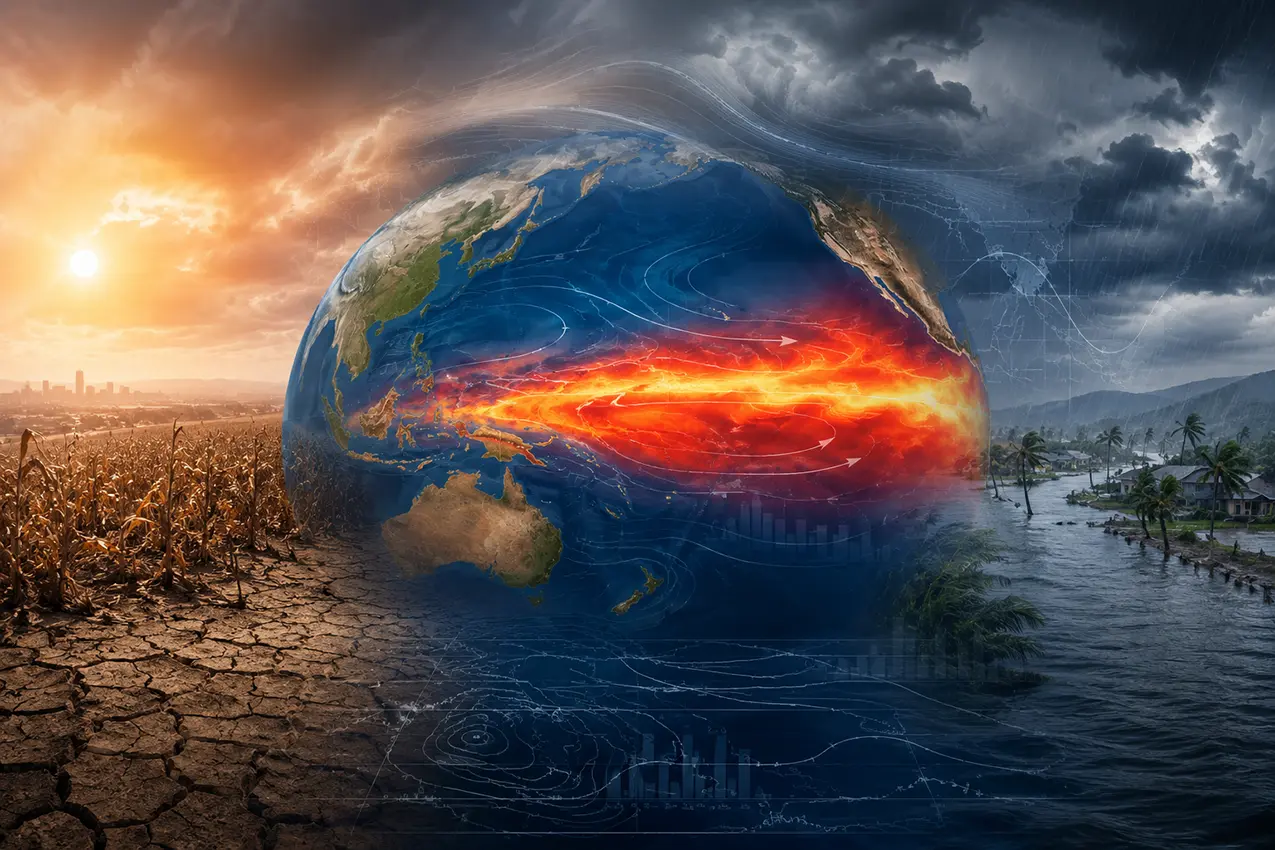
The mechanism is elegant — and worth holding in the mind, because everything else follows from it. In a normal year the trade winds blow from east to west along the equator, dragging warm surface water towards Indonesia and northern Australia, where it piles up in a pool that can top 30 degrees and run 150 metres deep. On the far side, off South America, the departing water is replaced by cold, nutrient-rich water welling up from below. That upwelling is why the Peruvian anchovy fishery is one of the richest on the planet, and why the eastern Pacific is cool and dry.
An El Niño begins when the trade winds falter. Without the wind holding it in place, the warm pool sloshes back eastward and spreads across the surface like spilt oil. The upwelling shuts down. The rain that normally falls over Indonesia follows the warm water east, to the mid-Pacific and the Americas. The atmosphere, in turn, weakens the trades further. The loop feeds itself, usually for nine to twelve months, until the system has spent the heat it was storing and swings back, often overshooting into its cold phase, La Niña.
The cycle recurs every two to seven years. It is older than agriculture. Coral cores and lake sediments show it running through the whole of the Holocene, and it was ruining anchovy seasons long before anyone had thought to measure carbon dioxide.4
That is the sceptic’s strongest card, and it deserves a fair hearing before we take it back.
The big ones
Not all El Niños are alike. Most are modest: the central Pacific warms by a degree or so, the monsoon wobbles, and the world moves on. A few, perhaps one in five, are what climatologists call extreme events. The warm pool does not merely spread but relocates, dragging the whole engine of tropical convection with it and rearranging weather on every continent.5
There have been four of these in the era of good measurement. The 1982–83 event caught the world by surprise, because the instruments were not yet in place; it bleached reefs from Panama to the Galápagos, brought floods to Peru and drought to eastern Australia, and prompted the line of moored buoys that now stretches along the equatorial Pacific.3 The 1997–98 event, long called the climate event of the twentieth century, killed an estimated 23,000 people in its floods, fires and epidemics and did tens of billions of dollars of damage; 1998 became the first year in which coral bleached across all three tropical oceans at once, the first global bleaching event.6 The 2015–16 event was hotter still at the surface and drove the third global bleaching event, the one that killed roughly half the shallow corals on the northern Great Barrier Reef.6 The 2023–24 event was weaker in the Pacific than either of those and yet produced the hottest year ever measured and the most extensive coral bleaching ever recorded, which is the first hint of the argument to come.7
Now the fifth. The event building in the Pacific this year was declared by the Bureau of Meteorology on 16 June.8 By mid-August the weekly index that climatologists use to grade El Niños stood at +2.7 degrees, already in the “very strong” band, and the World Meteorological Organization’s multi-model forecast has the seasonal average passing +2.9 for the spring, a value that would top both 1997 and 2015.9 Beneath the surface, in the 50 to 150 metre layer of the eastern Pacific, water is running more than 8 degrees warmer than usual, a reservoir that has not yet been spent.10 The head of long-range forecasting at Britain’s Met Office has said it is likely to be the most intense El Niño in more than a century.11 The peak is expected somewhere between November and January.
Same heat, different year
The sceptic’s card is now on the table, and it is a good one. El Niño is natural. It predates coal. A record set during the strongest El Niño in a century is, on this reading, a record set by the Pacific doing what the Pacific does, and to hang the fossil age on it is to mistake weather for climate — the very error scientists spend their careers warning the rest of us against.
Concede all of it, because it is true, and then notice what it leaves standing.
El Niño does not make heat. It moves it. The warm water that spread across the Pacific this month was already in the Pacific, banked up in the west, put there in large part by decades of an atmosphere that no longer lets heat escape at the old rate. What the oscillation governs is the timing of the disclosure: which year the stored heat comes to the surface, where the satellites can see it and the air can feel it. Burgess put the human contribution at about 0.8 degrees of long-term warming in the surface ocean itself, on which the El Niño’s temporary addition now rides.1 The natural swing decides which year gets the headline. The baseline decides what the headline says.
There is a second, subtler link, and the science is younger and less settled. Does a warming climate change El Niño itself? A landmark 2014 study led by Wenju Cai at the CSIRO, using twenty climate models, found that extreme El Niños of the 1982 and 1997 type should roughly double in frequency this century, from about one in twenty years to one in ten, because a warmer eastern Pacific makes it easier for the convection to relocate.5 Later work has broadly supported the finding, including a 2024 study in Nature that tested the same mechanism against ice-age records and found it held, though the models still disagree on details and a minority of researchers remain unpersuaded.12 If Cai is right, this year’s event is not just riding on the baseline. It may be the kind of event the baseline now favours.
Then there is a third strand, the one nobody fully understands. The 2023–24 El Niño was, on the Pacific indices, no giant. It should not, by the old arithmetic, have delivered the warmest year on record by the margin it did. Something else was at work: a decline in the reflective low cloud over the oceans, possibly linked to the cleaning-up of shipping fuel, possibly to warming itself.13 The upshot is that the planet absorbed more sunlight in 2023 than in any year on record, and the ocean took most of it. That heat did not leave when the El Niño did. It is part of what this year’s event has to draw on.
The deep ledger
The surface is only the ocean’s face. Behind it lies the quietest and most important number in climate science.
More than nine-tenths of the extra heat trapped by greenhouse gases since the industrial revolution has gone not into the air, where we feel it, but into the sea, where we do not.14 The land, the ice and the atmosphere share the remainder. That is why a chart of global air temperature looks jagged while a chart of ocean heat looks like a staircase.
We know this because of Argo: nearly four thousand robotic floats drifting through the world’s oceans at a depth of a kilometre, rising every ten days to take a temperature profile of the top two kilometres and radio it home. The array has been complete since the mid-2000s, is run by thirty countries, and releases its data free within hours; it is the reason ocean heat content has become the most trustworthy number in the field.15
In January a team of fifty-five scientists from thirty-one institutions reported that the upper two kilometres of the ocean held more heat in 2025 than in any year since measurements began, for the ninth year in a row. The annual gain was about 23 zettajoules, a number so large it needs translating: roughly thirty-seven years of the entire world’s energy consumption, absorbed by seawater in twelve months. The rate of warming has more than doubled since the 1960s. About a third of the ocean’s area was in its top three warmest years on record.16
The 2025 record was set as the Pacific slid towards La Niña — the cool phase. Ocean heat content does not care which phase the Pacific is in. It reads higher through El Niños and La Niñas alike, because the ledger is being written by the atmosphere, not the trade winds. What happened last weekend at the surface is a small, brief, visible expression of a vast, slow, invisible accumulation: the surface flush of a deep and patient fever.
What a warm sea does
The physics is unglamorous. The consequences are not.
It swells. Warm water takes up more room than cold, and about half of the sea-level rise measured since 1970 is nothing more than the same water expanding. The rest is melting ice, and that share is growing.17 Every centimetre reaches further inland on a storm tide.
It suffocates. Warm water holds less dissolved oxygen, and warm surface water floats more stubbornly on the cold water beneath it, cutting the depths off from resupply. The ocean has lost about two per cent of its oxygen since 1960, and the oxygen-starved zones of the tropics have grown by an area the size of the European Union.18 Fish kills follow marine heatwaves as surely as the smell follows a stranded whale.
It arms the weather. For every degree the sea surface warms, the air above it can hold about seven per cent more water vapour. A warm sea is a wet, energetic sea. The cyclones that form over it draw more fuel and dump more rain, and the surges they push ashore ride on water that is already higher.19 Lubchenco’s phrase, that a warm ocean destabilises weather patterns, is not rhetoric. It is thermodynamics.
It denies the night. Coastal cities survive heatwaves by the sea breeze. When the water off the beach is nearly as warm as the air, the breeze brings no relief and the night does not cool. Burgess made the point about Europe’s summer; it applies to Perth and Sydney just as well.1
It bleaches. Coral lives in partnership with algae that photosynthesise inside its tissue and give it colour and food. A degree or two above the summer maximum for a few weeks, and the coral expels the algae and starves, ghost-white. The Great Barrier Reef has bleached in six of the past ten summers: 2016, 2017, 2020, 2022, 2024 and 2025.20 The fourth global bleaching event, which began in early 2023, reached 84 per cent of the world’s reef area before NOAA declared it over in June; the coordinator of its Coral Reef Watch, Derek Manzello, said the era of near-annual bleaching has begun.7 Since 1998, every strong El Niño has coincided with a global bleaching event.7 The fifth may be months away.
It empties the pantry. Fish are cold-blooded and mobile. When the water warms they move poleward, taking fisheries across borders and out of reach of the people who depend on them. Warm, stratified surface water is also starved of the nutrients that feed plankton, and in the tropics the base of the food web thins as the water heats.21 The fishermen of Paita felt this first. In June 2023, as the warm water arrived, Peru’s Ministry of Production cancelled the main anchovy season outright. The adults had gone deep or south in search of cold water, the exploratory hauls came up full of juveniles, and to fish them would have been to eat the future. Peru’s anchoveta is the largest fishery on Earth by volume and supplies about a fifth of the world’s fishmeal and fish oil; the cancellation cost an estimated US$1.4 billion in exports and sent prices through the salmon farms and pig lots of three continents. A second season opened in October and was closed early, in January, to protect the spawning stock, with a quarter of its quota still in the water.21 The kelp forests of Tasmania and Western Australia, the reef’s temperate cousins, have already been stripped from long stretches of coast by marine heatwaves that arrived faster than the science could name them.22
Australia has had a preview of all this. The marine heatwave that sat off Western Australia through the summer of 2024–25 cooked Ningaloo and the Rowley Shoals, and NOAA now regards it as the event that closed the fourth global bleaching episode.7 The 2016 heatwave in the Tasman ran for 251 days and reached nearly three degrees above normal, killing oysters and abalone and pushing subtropical species south of Hobart.23 These were the rehearsals.
Count the days. The number of marine-heatwave days the world’s oceans endure each year has more than tripled since the early 1990s.2 None of this is forecast. All of it is measurement.
The web
A warmer ocean does not stay in its lane. Four connections matter more than the rest.
The first is carbon. The sea absorbs about a quarter of everything we emit, and it has done so quietly for two centuries, which is the main reason the atmosphere is not worse than it is.24 Gas dissolves less readily in warm water, so a hotter ocean is a weaker sponge, and a weaker sponge leaves more of what we emit in the air. Copernicus made the point in its own statement on the record.2 The ocean is acidifying at the same time, because of the carbon it does absorb, and that is a separate injury from the same cause. Warming does not make the sea more acidic, contrary to a line in the AP copy; what it does is make the sea less able to shield us from the thing that does.25
The second is ice. The great ice shelves of West Antarctica are not melting from the top. They are melting from below, where warm circumpolar deep water reaches the grounding lines and eats at the ice from underneath. The Thwaites and Pine Island glaciers, which hold enough ice between them to raise the sea by more than a metre, are retreating for that reason.26 Warm water is the knife.
The third is circulation. The Atlantic’s great overturning current, which carries tropical heat north and makes Europe habitable at its latitude, is driven by cold, salty water sinking near Greenland. Warm the surface and freshen it with meltwater, and the sinking weakens. The evidence that it has already slowed is strong; the argument over whether it could collapse this century is live and unresolved, and the honest position is that nobody knows the odds.27
The fourth is the land. An El Niño moves rain as surely as it moves heat. The monsoon over India weakens; the Amazon dries and burns; Indonesia’s peat forests, already deep in a long dry season this year, become tinder; East Africa’s short rains flood.28 For Australia the textbook says drought, and the textbook is being rewritten as it is read: the country is on course for the wettest El Niño on record, an anomaly that shows how far the old teleconnections can be bent when the whole ocean is warm.29 No one should take comfort from that. A wet El Niño in a hot ocean means cyclones and floods, not relief.
Nor will the Pacific be acting alone. The WMO expects a positive Indian Ocean Dipole to develop alongside the El Niño — the western Indian Ocean warmer than usual, the eastern cooler — a pairing that has historically dried south-eastern Australia and the Indian Ocean rim while flooding East Africa. When the two are in play at once their regional effects compound rather than cancel, which is why the WMO has begun briefing humanitarian agencies months ahead of the peak.28
The prognosis
What do the scientists say comes next? The forecasts are unusually confident, and unusually grim.
The event will strengthen through spring and peak around the turn of the year. Most of the heat it releases into the atmosphere arrives in the following calendar year, which is why 1998 was hotter than 1997 and 2016 hotter than 2015. The WMO’s five-year outlook, issued in May, already gave an 86 per cent chance that a year before 2030 would beat 2024 as the warmest on record; its lead author noted that an El Niño in late 2026 makes 2027 the obvious candidate.30
Zeke Hausfather of Berkeley Earth and Andrew Dessler of Texas A&M have done the arithmetic. A strong El Niño adds roughly 0.3 degrees to the underlying warming trend. On the current trend that puts 2027 at about 1.76 degrees above pre-industrial levels: a single year that compresses into itself the warming otherwise expected by 2037. Dessler calls it a preview of the future. Michael McPhaden of NOAA, who has spent a career on the Pacific buoy array, thinks 1.7 is not inconceivable.31 A year at 1.7 does not mean the Paris target has been permanently breached; the target is a long-term average, not a single year. It means we get to see the 2030s early.
The human ledger is as long as the physical one. A study published in Nature Climate Change in January put numbers on what strong El Niños do to life expectancy in the wealthy countries of the Pacific rim: the 1982–83 event cost those populations about half a year of life expectancy, the 1997–98 event about four-tenths, through heat, disease and the slow erosion of mortality gains that follows disasters — losses the authors value in the trillions of dollars and find falling hardest on the middle-aged. Under a moderate emissions pathway they project a cumulative loss of 2.8 years by the end of the century.34
For the ocean, the forecasts are specific. NOAA’s bleaching outlook shows high risk across the northern Pacific, Florida and the Caribbean later this year; the Great Barrier Reef’s danger period is the southern summer, precisely when this event will peak.7 The Bureau expects a more active cyclone season. Burgess expects the surface record set last week to be broken again before the El Niño peaks, because the ocean will keep warming through months in which it ought to cool.1
Beyond the year, the trajectory is the one the ocean heat ledger has been writing for sixty years, only steeper. The heat now stored below two kilometres, in the abyss, will take centuries to return to the surface whatever we do; sea-level rise from expansion alone is committed for that long.32 The surface record we are discussing is the part of the story that can still be changed. The deep ocean is the part that cannot.
What the number cannot tell you
One admission is owed, because the honest reader will make it anyway.
A single daily record, edged by hundredths of a degree, is thin evidence on its own. The ERA5 dataset behind it is a reanalysis: a weather model constrained by satellites and buoys rather than a bucket over the side. It is the best tool we have for a global daily value, and its last decimal place deserves a little humility.2 If the case for alarm rested on 21.10 beating 21.09 it would deserve the scepticism it would get.
It does not rest there. It rests on the year: a run of record or near-record months through 2026 before the El Niño had properly begun.2 It rests on the decade: nine straight years of record ocean heat content.16 It rests on the physics — which has not changed since Fourier worked out in 1824 that the atmosphere holds heat and Tyndall showed in 1859 which gases do the holding.
The daily record is the sentence everyone will quote. The paragraph it belongs to is longer and worse.
What to watch
The ocean will cool again, eventually, when this El Niño exhausts itself and the trade winds return and the warm water banks back up against Indonesia for the next time. The surface record will stand for a while and then fall. The ledger beneath will not fall. It has never yet fallen.
Three things are worth watching between now and the southern autumn. The Niño 3.4 index, published weekly by NOAA and fortnightly by the Bureau, will tell you whether this event has passed 1997 and 2015 to become the strongest ever measured; the forecasts say it will, by November.9 The Copernicus daily sea-surface chart, free and updated every morning, will show whether the red line of 2026 keeps running above every grey line since 1979 into the months when it should be falling.33 NOAA’s Coral Reef Watch will tell you, week by week, whether the fifth global bleaching event has begun.7
None of those charts can be argued with. They are not models of the future. They are the present, taking its own temperature. On a weekend in late August the sea, which for the whole of recorded history has known what month it is, forgot. It is worth asking who taught it to.
Notes
- Associated Press, “Ocean temperatures hit ‘very troubling’ record high,” ABC News, 25 August 2026, https://www.abc.net.au/news/2026-08-25/ocean-temperatures-hit-record-spurred-by-el-ni%C3%B1o/107073982. The source of the Lubchenco remarks, the 0.8 °C estimate of long-term human warming of the surface ocean, the sea-breeze observation, and Burgess’s expectation that the ocean will keep warming until the El Niño peaks. This essay is written in acknowledgement of, and as a response to, that report. ↩
- Copernicus Climate Change Service, “Daily global sea surface temperature breaks 2024 record,” 24 August 2026, https://climate.copernicus.eu/copernicus-daily-global-sea-surface-temperature-breaks-2024-record. The daily mean for the extra-polar ocean (60°S–60°N) in the ERA5 reanalysis was 21.104 °C on 21 and 22 August 2026, against 21.09 °C in March 2024 and a previous August high of 20.98 °C in 2023; both days were roughly 0.67 °C above the 1991–2020 mean for the date. The Burgess quotation, the “more than tripled since the early 1990s” figure for marine-heatwave days and the point about reduced CO₂ uptake are all from this statement. ERA5 blends satellite and in-situ observations through a weather model, which is why it can report a global daily value at all, and why its last decimal deserves the humility conceded in the text. ↩
- The history is told in S. George Philander, El Niño, La Niña, and the Southern Oscillation (Academic Press, 1990), and in Michael J. McPhaden, Agus Santoso and Wenju Cai, eds., El Niño Southern Oscillation in a Changing Climate (American Geophysical Union, 2020). Walker’s papers on the Southern Oscillation appeared in the Memoirs of the Indian Meteorological Department from 1923; Bjerknes’s synthesis is “Atmospheric Teleconnections from the Equatorial Pacific,” Monthly Weather Review 97 (1969). The TAO/TRITON buoy array, developed in the decade after 1982–83, is described in McPhaden et al., “The Tropical Ocean-Global Atmosphere Observing System,” Journal of Geophysical Research 103 (1998). ↩
- Kim M. Cobb et al., “Highly Variable El Niño–Southern Oscillation Throughout the Holocene,” Science 339 (2013), reconstructs the oscillation from fossil corals over 7,000 years. The same paper finds recent decades unusually intense against that record, though the authors stop short of attributing the change. ↩
- Wenju Cai et al., “Increasing Frequency of Extreme El Niño Events Due to Greenhouse Warming,” Nature Climate Change 4 (2014): 111–116. Twenty CMIP models; extreme events, defined by the eastward relocation of convection, roughly double from about one per twenty years to one per ten under continued warming. The “one in five” ratio in the text follows from an El Niño recurring every two to seven years and an extreme one every twenty. ↩
- The 1997–98 casualty and cost figures are the commonly cited NOAA and WMO estimates (about 23,000 deaths; US$32–45 billion), which remain approximate. The three earlier global bleaching events are 1998, 2010 and 2014–17; see C. Mark Eakin et al., “The 2014–2017 Global-Scale Coral Bleaching Event,” Coral Reefs 38 (2019). Northern Great Barrier Reef mortality in 2016 is from Terry P. Hughes et al., “Global Warming Transforms Coral Reef Assemblages,” Nature 556 (2018). ↩
- NOAA Coral Reef Watch, “Current Global Bleaching: Status Update,” https://coralreefwatch.noaa.gov/satellite/research/coral_bleaching_report.php, and the 2 June 2026 announcement that the fourth global event had likely ended, with bleaching-level heat stress having reached about 84 per cent of the world’s reef area between January 2023 and September 2025. Manzello’s remarks on near-annual bleaching, the observation that every strong El Niño since 1998 has coincided with a global event, and the identification of the 2024–25 Western Australian heatwave as the event’s close are from that announcement and NOAA’s four-month bleaching outlook. ↩
- Australian Bureau of Meteorology, Climate Driver Update, 16 June 2026; reported in ABC News, “El Niño declared by BOM and it could become the strongest on record,” 16 June 2026. ↩
- World Meteorological Organization, Global Seasonal Climate Update, August–September–October 2026, https://wmo.int/resources/publication-series/global-seasonal-climate-update/gscu-aso2026, and “Strong El Niño expected to intensify,” WMO press release, August 2026. The multi-model ensemble projects a seasonal Niño 3.4 anomaly of about +2.9 °C peaking in November. For comparison, the three-month Oceanic Niño Index peaked at +2.2 in 1982–83, +2.4 in 1997–98, +2.6 in 2015–16 and +2.0 in 2023–24 (NOAA Climate Prediction Center). The weekly value of +2.7 °C centred on 12 August is from the International Research Institute for Climate and Society, “ENSO Quick Look,” August 2026. ↩
- IRI, “ENSO Quick Look,” August 2026, https://iri.columbia.edu/our-expertise/climate/forecasts/enso/current/: subsurface anomalies exceeding 8 °C at 50–150 m depth between 150°W and 80°W. NOAA has reported values up to 10 °C at depth. ↩
- Agence France-Presse, “What a record-breaking El Niño could mean for the world,” 20 August 2026, quoting the Met Office’s head of long-range forecasting; the Met Office statement itself was issued the same week. ↩
- The 2024 Nature study is “Future Increase in Extreme El Niño Supported by Past Glacial Changes,” Nature 634 (2024), which finds the mechanism behind extreme events operating consistently across glacial and warm states. A useful review of the wider, still-contested literature is Cai et al., “Anthropogenic Impacts on Twentieth-Century ENSO Variability Changes,” Nature Reviews Earth & Environment 4 (2023): 407–418. ↩
- Helge F. Goessling, Thomas Rackow and Thomas Jung, “Recent Global Temperature Surge Intensified by Record-Low Planetary Albedo,” Science 387 (2024), attributing much of the unexplained 2023 warmth to a decline in low cloud. The shipping-fuel hypothesis, which points to the 2020 International Maritime Organization sulphur rules, is argued most forcefully in James Hansen et al., “Global Warming Has Accelerated,” Environment: Science and Policy for Sustainable Development 67 (2025). The relative weights remain disputed. ↩
- Intergovernmental Panel on Climate Change, Climate Change 2021: The Physical Science Basis, Working Group I, ch. 7 (Cambridge University Press, 2021): the ocean took about 91 per cent of the Earth-system heat gain over 1971–2018, land about 5 per cent, ice about 3 per cent and the atmosphere about 1 per cent. The figure in the text uses those proportions. ↩
- Dean Roemmich et al., “On the Future of Argo: A Global, Full-Depth, Multi-Disciplinary Array,” Frontiers in Marine Science 6 (2019), and the Argo programme, https://argo.ucsd.edu. The core array of about 3,900 floats was declared complete in 2007. ↩
- Yuying Pan, Lijing Cheng, John Abraham, Kevin Trenberth et al., “Ocean Heat Content Sets Another Record in 2025,” Advances in Atmospheric Sciences (2026), https://doi.org/10.1007/s00376-026-5876-0. Fifty-five authors from thirty-one institutions; upper-2,000 m heat content up about 23 ± 8 ZJ on 2024; about 33 per cent of ocean area in its top three warmest years; the warming rate rising from 0.14 W m⁻² per decade over 1960–2025 to 0.32 over 2005–2025. The “thirty-seven years of global energy consumption” comparison is the Institute of Atmospheric Physics’ own, at 2023 levels of about 620 EJ per year. “Ninth consecutive record” is the count reported by Inside Climate News, 9 January 2026. ↩
- IPCC, Climate Change 2021, WGI ch. 9: thermal expansion accounts for about half of observed global mean sea-level rise over 1971–2018, with glacier and ice-sheet loss making up most of the remainder; the ice share has been rising. ↩
- Sunke Schmidtko, Lothar Stramma and Martin Visbeck, “Decline in Global Oceanic Oxygen Content During the Past Five Decades,” Nature 542 (2017), for the two per cent loss since 1960; Denise Breitburg et al., “Declining Oxygen in the Global Ocean and Coastal Waters,” Science 359 (2018), for the roughly 4.5 million km² expansion of tropical oxygen-minimum zones, an area comparable to the European Union. ↩
- The seven-per-cent-per-degree figure is the Clausius–Clapeyron relation. On cyclone rainfall and surge, see Kerry Emanuel, “Atlantic Tropical Cyclones Downscaled from Climate Reanalyses Show Increasing Activity over Time,” Nature Communications 12 (2021), and IPCC, Climate Change 2021, WGI ch. 11. ↩
- Australian Institute of Marine Science and Great Barrier Reef Marine Park Authority, annual reef snapshots and aerial bleaching surveys, 2016–2025. The 2026 summer had not been assessed at the time of writing. ↩
- William W. L. Cheung et al., “Shrinking of Fishes Exacerbates Impacts of Global Ocean Changes on Marine Ecosystems,” Nature Climate Change 3 (2013), on poleward shifts and body-size decline; Michael J. Behrenfeld et al., “Climate-Driven Trends in Contemporary Ocean Productivity,” Nature 444 (2006), on falling productivity in the warming, stratifying tropics. Peru’s Ministry of Production (PRODUCE) cancelled the first 2023 anchoveta season in the north-central zone in June 2023 after exploratory fishing found the biomass dominated by juveniles displaced by El Niño-warmed water; the second season opened in October 2023 and was closed early in January 2024 to protect spawning, leaving about 25 per cent of the quota uncaught. Peru supplies roughly 20 per cent of global fishmeal and fish oil; the lost export sales from the cancellation were estimated at US$1.4 billion (PRODUCE and IFFO figures, reported by Reuters and Undercurrent News, June 2023–January 2024). ↩
- Thomas Wernberg et al., “Climate-Driven Regime Shift of a Temperate Marine Ecosystem,” Science 353 (2016), on the loss of kelp forest along roughly 100 km of Western Australian coast after the 2011 marine heatwave; Craig R. Johnson et al., “Climate Change Cascades: Shifts in Oceanography, Species’ Ranges and Subtidal Marine Community Dynamics in Eastern Tasmania,” Journal of Experimental Marine Biology and Ecology 400 (2011), on the collapse of Tasmanian giant kelp. ↩
- Eric C. J. Oliver et al., “The Unprecedented 2015/16 Tasman Sea Marine Heatwave,” Nature Communications 8 (2017): 251 days, peak intensity about 2.9 °C above climatology, with documented impacts on oyster and abalone fisheries and southward range shifts. ↩
- Global Carbon Project, Global Carbon Budget 2025 (November 2025), https://globalcarbonbudget.org: the ocean sink takes up roughly a quarter of anthropogenic CO₂ emissions. ↩
- Scott C. Doney et al., “Ocean Acidification: The Other CO₂ Problem,” Annual Review of Marine Science 1 (2009). Acidification is driven by CO₂ dissolving to form carbonic acid; temperature affects the rate of uptake, not the chemistry of the acid. The AP copy’s phrasing (“when the ocean warms, it becomes more acidic”) conflates the two. ↩
- Hamish D. Pritchard et al., “Antarctic Ice-Sheet Loss Driven by Basal Melting of Ice Shelves,” Nature 484 (2012); Eric Rignot et al., “Widespread, Rapid Grounding Line Retreat of Pine Island, Thwaites, Smith, and Kohler Glaciers, West Antarctica, from 1992 to 2011,” Geophysical Research Letters 41 (2014). The combined sea-level equivalent of the Thwaites and Pine Island basins is a little over a metre; the wider Amundsen Sea sector holds more. ↩
- Levke Caesar et al., “Observed Fingerprint of a Weakening Atlantic Ocean Overturning Circulation,” Nature 556 (2018), for the roughly 15 per cent slowdown since the mid-twentieth century; Peter Ditlevsen and Susanne Ditlevsen, “Warning of a Forthcoming Collapse of the Atlantic Meridional Overturning Circulation,” Nature Communications 14 (2023), for the contested mid-century collapse estimate, and the IPCC’s assessment (WGI ch. 9) that a collapse before 2100 is unlikely but cannot be excluded. ↩
- The regional teleconnections are summarised in the WMO El Niño/La Niña Update series and in Cai et al., ENSO in a Changing Climate (n. 3). The positive Indian Ocean Dipole forecast and the humanitarian briefings are from WMO, “Strong El Niño expected to intensify,” August 2026 (n. 9). Indonesia’s 2026 dry-season fires were reported by AFP, 20 August 2026 (n. 11). ↩
- ABC News, “Australia on track for wettest El Niño on record,” 22 August 2026, https://www.abc.net.au/news/2026-08-22/australia-weather-on-track-for-wettest-el-nino-on-record/107064594. ↩
- World Meteorological Organization, Global Annual to Decadal Climate Update 2026–2030, May 2026: an 86 per cent probability that at least one year in the period exceeds 2024, and a 91 per cent probability that at least one year exceeds 1.5 °C above 1850–1900. Leon Hermanson’s remark on 2027 was reported by Climate Home News, 28 May 2026. ↩
- AFP, “What a record-breaking El Niño could mean for the world,” 20 August 2026 (n. 11), reporting the Hausfather–Dessler estimate of about +0.3 °C from El Niño and a 2027 global mean near 1.76 °C above pre-industrial, and McPhaden’s comment. Hausfather’s underlying analysis drew on 667 simulations from fourteen seasonal forecasting systems. ↩
- Lijing Cheng et al., “Past and Future Ocean Warming,” Nature Reviews Earth & Environment 3 (2022): 776–794, on the multi-century timescale of deep-ocean heat uptake and the committed sea-level rise from thermal expansion. ↩
- Copernicus Climate Pulse, https://pulse.climate.copernicus.eu, which publishes daily global sea-surface and air temperatures against every year since 1979. ↩
- “Enduring Impacts of El Niño on Life Expectancy in Past and Future Climates,” Nature Climate Change (January 2026), https://doi.org/10.1038/s41558-025-02534-4: life-expectancy losses of about 0.5 years (1982–83) and 0.4 years (1997–98) across high-income Pacific Rim countries, valued at US$2.6 trillion and US$4.7 trillion respectively; a projected cumulative loss of 2.8 years by 2100 under a moderate emissions pathway. ↩