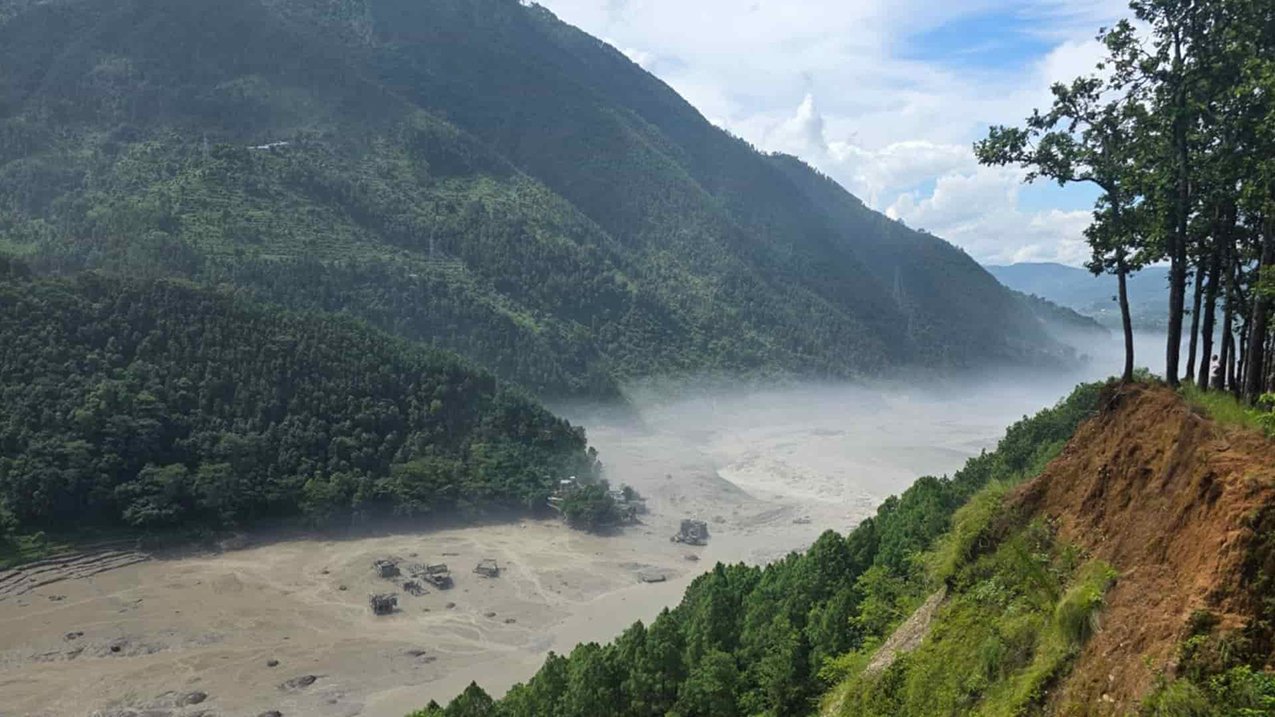

Dossier · Cryosphere · One month on
A month after the Lhende Khola disaster, the satellites have found the glacier, the second flood has come and gone quietly, and the counting has become the hardest work in Nepal. What we know now, what remains contested, and how the open questions could actually be answered.
This dossier is the sequel to “Nepal Flash Flood Disaster: A Grim Warning as the World’s Ice Melts,” written in the first 48 hours of the Rasuwa disaster and preserved unaltered as a record of what was knowable then.1 A month has passed. This is the reckoning.
I. The count
On 28 August we published a toll of 469 dead and more than 1,000 missing, and warned that the figures would rise. They did, terribly. One month on, the Government of Nepal records more than 1,451 dead and over 5,000 still missing; the United Nations puts total damage and losses at around 4 to 5 per cent of Nepal’s gross domestic product.2 Figures reported from the Tibetan side add 43 dead and around 519 missing, and the river carried some of its victims 240 kilometres into India.3
The word missing is doing heavy work in those numbers. Nepal’s disaster authority counts 1.6 million people affected across Rasuwa, Nuwakot and Dhading; roughly 7,500 homes destroyed and 20,000 damaged; 41 bridges gone. Unidentified bodies are being held in 21 hospitals, and the government has resorted to temporary burials while families search. The Associated Press reports survivors holding symbolic funerals, lighting lamps for people the river never returned.4 Some of the missing are dead and uncounted; some are counted twice across a closed border; a few walked out and never made a list. The count will converge slowly, and it will never be exact. That is not administrative failure. It is what this kind of flood does to the idea of a record.
II. What the satellites settled
The mountain has a name now. Open-data reconstruction places the failure on the north flank of the Langtang Himal, immediately below the summits of Langtang Lirung and Tsangbu Ri: a section of glacier roughly 600 metres wide let go at 8:37 that morning and fell into the headwaters of the Lhende.5 Pause on the name. Langtang Lirung is the mountain whose opposite face, shaken loose by the April 2015 earthquake, produced the avalanche that erased Langtang village.6 The same massif has now destroyed communities on both of its sides within eleven years — once triggered by the earth, once by nothing at all.
The physics has firmed too. One satellite reconstruction estimates the flood at roughly 100 million cubic metres of debris-laden water, running 70 to 134 metres deep in the gorges at 37 to 52 metres per second — figures consistent with the 193 km/h average that Jeffrey Kargel calculated in week one. Falling ice makes a peculiar flood: friction melts it in transit, the melt entrains sediment, the sediment thickens the flow. The USGS catalogue entry for the magnitude 5.2 event now reads, simply, landslide.7 The thesis our first dossier hung its title on — that the collapse was the earthquake — is no longer an interpretation. It is a catalogue entry.
And the debris dam that first reports treated as a sustained impoundment appears to have held for minutes, not hours, before the stored water burst through.8 The cascade was faster and more continuous than the early sketches allowed — which is worth remembering next time an early sketch, including ours, looks tidy.
One episode from this month deserves its own paragraph, because it shows evidence behaving well. The team behind the open-data reconstruction published a sediment-depth estimate — a 10-to-18-metre wedge on the valley floor — then discovered their method had used the wrong viewing geometry, retracted the figure publicly, and released a corrected analysis from a stereo elevation model along with the underlying data.9 That is what honest quantification looks like: not the absence of error, but error with a paper trail. Readers of this site will recognise the principle; it is why our exhibits carry caveat boxes.
The same massif has destroyed communities on both of its sides within eleven years — once triggered by the earth, once by nothing at all.
III. The second flood that didn’t come
In August the most frightening sentence in the file was the barrier lake upstream. Here is how that story ended, or rather didn’t. On 28 August the lake behind the avalanche debris overflowed, halting rescue work on both sides of the border; Chinese state media called the risk manageable, and it proved so.10 By month’s end the lower lake had drained completely.11 Attention shifted to a second accumulation higher in the catchment — a water-filled impact crater about 5.6 kilometres upstream at roughly 3,700 metres, holding around 1.4 million cubic metres at the end of August — which authorities on both sides continue to watch, along with the fresh possibility of renewed collapse from the source area.12
It would be easy to file this under luck. It is better filed under drainage: debris dams of this kind often bleed out through their own rubble rather than failing catastrophically, and this one did. But for a week, thousands of people camped above a river that had already taken everything, under official instructions to stay off the banks where the bodies of their families lay. The search teams needed the riverbanks; the riverbanks were the one place no one should stand.13 The second flood did not come. The fear of it was a disaster of its own.
IV. The ledger of loss
The economic accounting has hardened from anecdote into national statistics, and the national statistics are grim. Damage and losses at 4 to 5 per cent of GDP place Rasuwa among the costliest disasters in Nepal’s modern history — proportionally, the kind of hit that erases a year’s growth.14 The hydropower toll has grown with the counting: the UN records 13 projects affected; CARE counts 14 hydropower and solar projects with a combined capacity of about 748 megawatts; the Prime Minister has cited 431 megawatts of disrupted generation. The figures measure different things — projects touched, capacity affected, output lost — and the piece of the truth each holds is still being reconciled.15 The entire road from Betrawati to the Rasuwagadhi crossing is gone.16
The trade artery matters more than its length suggests. Gyirong–Rasuwagadhi carried about 30 per cent of all Nepal–China trade, and more than 100,000 people crossed there in the first half of 2026.17 Both figures are now zero, and will stay near zero through a Himalayan winter that is arriving with an estimated 2.2 million tonnes of debris still uncleared and thousands of the displaced in holding centres.18
Against damage on the order of two billion US dollars, the Government and the UN launched a Flash Appeal on 4 September: 49.6 million dollars, for 84,000 people across 17 municipalities.19 The appeal is well designed and, as of this writing, not fully funded. Set the two numbers side by side and you have the loss-and-damage debate in miniature: the arithmetic of the harm and the arithmetic of the help are not on the same axis.
V. The evidence, tiered
A month is long enough to sort the file properly. Following this site’s method, four tiers, from bedrock to conjecture.
The state of the evidence — 29 September 2026
- Fact: the collapse was the seismic event — the USGS catalogue records the M5.2 as a landslide, not an earthquake. There was no rain. The source is a hanging glacier section, roughly 600 m across, on the Langtang Himal’s north flank below Langtang Lirung and Tsangbu Ri. Heavy snowmelt occurred around the source in the preceding 24 hours. Any damming of the Lhende was brief. A barrier lake formed, overflowed on 28 August, and subsequently drained without a second catastrophe.
- Strong inference: warming is the background driver — thinning ice and degrading permafrost destabilising a steep frozen face, consistent with the regional record (Hindu Kush Himalaya glaciers losing mass 65 per cent faster decade on decade) and with expert reading of this event (Byers, Ekström). The 2025 Lhende flood was, in hindsight, a warning of upstream instability.
- Contested: the source elevation (reported at both ~5,200 m and ~5,600 m) and its side of the frontier — the detachment sits essentially on the watershed line. The flood volume (~100 million m³ is an open-data estimate, not an official one). And whether this was an early-warning “failure”: our first dossier stressed that Nepal’s rain-keyed systems never fired, but analysts at the Stimson Center argue it is wrong to read the event as a warning-system failure at all — no deployed system anywhere is built to catch a spontaneous glacier detachment, and the gauges that could have relayed the surge were destroyed by it.
- Speculation: direct attribution of this collapse to climate change (no formal study yet); whether the warm, snow-poor fortnight beforehand was decisive or incidental; the role of monsoon saturation in the entrained sediment.
The contested tier is where the interesting work lives. On the warning question, both things are true: the systems did not fail at their job, and their job was defined too narrowly for the mountains we now have.20 The Kathmandu University glaciologist Rijan Bhakta Kayastha noted within hours that the Lhende basin holds several large glacial lakes and had been blocked before — the hazard was legible in advance, even if this particular failure mode was not.21
VI. A hypothesis, named
Our method requires a position, so here is ours, stated so it can be wrong. The Langtang hypothesis: a hanging glacier on the Langtang Himal’s north face, unmonitored and warming, lost the thermal bond holding it to its bed — degrading permafrost in the rock beneath, a warming ice–rock interface within — and was tipped across the failure threshold by the meltwater pulse of an unusually warm, snow-poor fortnight, the final 24 hours of intense melt acting as trigger rather than cause. No earthquake was needed because the mountain had been disarmed from within.
This is the leading reading among the scientists who have spoken — Byers on permafrost, Ekström on the seismic signature, Shugar on the melt pulse22 — but it is a hypothesis, not a finding. So: how it could be tested.
Read the scar. A field or drone survey of the detachment surface can establish whether the failure plane ran through rock, ice, or the frozen junction between them, and borehole temperatures in the adjacent face can show whether the permafrost there sits near zero. Blatten’s investigators did exactly this; the scar is the crime scene.
Rewind the seismographs. Before the Birch Glacier fell, precursor signals were detectable for weeks. The global and regional networks that caught the M5.2 hold months of archived data for this massif; a retrospective search for creep and stick-slip signatures would show whether this collapse announced itself to instruments nobody had pointed at it.
Reconstruct the heat. Reanalysis data and satellite imagery can quantify exactly how anomalous the pre-collapse fortnight was against the past four decades — and a formal attribution study can then say how much more likely warming made such a fortnight. That is a solved methodology awaiting application.
Count the twins. The most consequential test is an inventory: how many hanging glaciers of this class sit above roads, dams and towns in the Hindu Kush Himalaya? ICIMOD, asking “Why was no one monitoring this mountain?”, answers candidly that almost nobody monitors any mountain this way: the region holds some 54,000 glaciers and more than 2,000 glacial lakes, monitoring effort has concentrated on the lakes, and Bhutan’s single instrumented valley cost around US$8 million. The realistic programme is triage — rank the slopes above infrastructure, instrument the worst first.23 If the Langtang hypothesis survives the scar and the seismographs, that inventory stops being research and becomes civil defence.
VII. Coda
A month ago we wrote that the mountain kept its own seismograph. We can now be more precise. The mountain has a name, a face, a twin disaster on its far side, and a class of siblings above valleys from the Karakoram to the Andes that no one is watching either. The first dossier ended by calling the collapse a warning. The month since has clarified what the warning says: not merely that the ice is going, but that our instruments, our budgets and our definitions of early warning are still calibrated to the mountains of the last century.
The count in Rasuwa will keep rising slowly toward a number that will never be final. The test of this disaster is not that number. It is whether, when the next unstudied glacier lets go, the sentence “nobody was watching it” is still true.
Notes
- K.J. Parker, “The Earthquake That Wasn’t,” kevinparker.com.au, 27–28 August 2026, https://kevinparker.com.au/nepal-flash-flood-disaster-a-grim-warning-as-the-worlds-ice-melts/. Global glacier data, hotspot analysis and the full August source file are cited there and not repeated here.↩
- “One Month Since the Rasuwa Floods: Six Ways Coordinated Action Is Making a Difference,” United Nations Sustainable Development Group, 28 September 2026, https://unsdg.un.org/latest/stories/one-month-rasuwa-floods-six-ways-coordinated-action-making-difference.↩
- “2026 Nepal–Tibet Floods,” Wikipedia, accessed 29 September 2026 (compilation of official Nepali and Chinese figures; cited as an aggregate of primary references), https://en.wikipedia.org/wiki/2026_Nepal–Tibet_floods.↩
- “Response Update: Nepal Flash Floods 2026,” Convoy of Hope, September 2026 (NDRRMA figures; AP reporting on symbolic funerals), https://convoyofhope.org/disaster-relief/nepal-flash-flooding-26/.↩
- “Bhote Koshi Flood 2026: A Reconstruction from Open Satellite Data,” Geopera, August–September 2026, https://geopera.com/blog/bhote-koshi-flood-2026-satellite-analysis; “August 2026 Nepal Trishuli Flood,” ArcGIS StoryMaps, updated September 2026, https://storymaps.arcgis.com/stories/f2b2425eac544929a7d18f4c90b41d66.↩
- Wikipedia, “2026 Nepal–Tibet Floods” (noting Langtang Lirung’s 2015 earthquake-triggered collapse opposite the 2026 site).↩
- Geopera, “Bhote Koshi Flood 2026.”↩
- “Nepal Floods of 2026,” Encyclopaedia Britannica, accessed 29 September 2026, https://www.britannica.com/event/Nepal-floods-of-2026.↩
- Geopera, “Bhote Koshi Flood 2026” (retraction notice and corrected stereo-model analysis linked therein).↩
- “Why Nepal Faces Another Flood Threat from a New Lake on China Border,” Al Jazeera, 28 August 2026, https://www.aljazeera.com/news/2026/8/28/is-nepal-facing-another-devastating-flood-from-a-new-lake.↩
- “Nepal Flash Flood at the Tibet Border, Mapped,” Mappr, updated September 2026, https://www.mappr.co/nepal-flash-flood-rasuwagadhi/; “Natural Disaster Alert: Continued Flood and Landslide Risk, Rasuwa District,” OSAC, US Department of State, late August 2026, https://www.osac.gov/Content/Report/279b87cd-5d3f-4583-bf7c-2af9605a0232.↩
- Mappr, “Nepal Flash Flood at the Tibet Border” (crater-lake dimensions per Chinese water-ministry statements); “A Cascading Disaster on the Nepal–China Border: What to Know About the August 2026 Rasuwa Flood, 72 Hours Later,” Stimson Center, September 2026, https://www.stimson.org/2026/a-cascading-disaster-on-the-china-nepal-border-what-to-know-about-the-august-2026-rasuwa-flood/.↩
- Mappr, “Nepal Flash Flood at the Tibet Border.”↩
- UNSDG, “One Month Since the Rasuwa Floods.”↩
- UNSDG, “One Month Since the Rasuwa Floods”; “Nepal Flash Floods 2026: CARE’s Emergency Response,” CARE, September 2026, https://www.care.org/news-and-stories/nepal-flash-floods-2026-care-emergency-response/; Prime Minister’s 431 MW figure as reported by Convoy of Hope, “Response Update.”↩
- CARE, “Nepal Flash Floods 2026.”↩
- Wikipedia, “2026 Nepal–Tibet Floods” (trade share and crossing figures per Chinese media reports compiled there).↩
- UNSDG, “One Month Since the Rasuwa Floods”; displaced-persons figures per Mappr, “Nepal Flash Flood at the Tibet Border.”↩
- UNSDG, “One Month Since the Rasuwa Floods”; “Nepal: Rasuwa Flood Flash Update #5,” UN OCHA via ReliefWeb, 1 September 2026, https://reliefweb.int/report/nepal/nepal-rasuwa-flood-flash-update-5-1-september-2026.↩
- Stimson Center, “A Cascading Disaster on the Nepal–China Border.”↩
- “Scientists Suspect Ice Avalanche Triggered Bhotekoshi Flood,” Kathmandu Post, 26 August 2026, https://kathmandupost.com/national/2026/08/26/scientists-suspect-ice-avalanche-triggered-bhotekoshi-flood.↩
- “Glacier Collapse Caused Nepal’s Deadly Flash Flood — A Sign of Things to Come?,” Nature News, 27 August 2026, https://www.nature.com/articles/d41586-026-02716-w; expert readings summarised in Parker, “The Earthquake That Wasn’t,” §IV.↩
- “Kyirong–Rasuwa Flood 2026: Nepal–China Cryosphere Risk,” ICIMOD, September 2026, https://www.icimod.org/kyirong-rasuwa-flood-2026-nepal-china-border/.↩
Casualty, damage and appeal figures are as published by the Government of Nepal, the United Nations and cited relief agencies at 29 September 2026 and remain subject to revision; Nepali and Chinese counts may overlap. The Langtang hypothesis in §VI is the author’s synthesis of published expert commentary, stated for testing, not a scientific finding. Nothing in this article attributes legal responsibility for the disaster to any person or entity.